
25 Imaging the Living Brain
The earliest methods of analyzing nervous system anatomy were crude: manual dissection of the brain post-mortem (after death). The techniques discussed below were developed to allow scientists to see some aspect of the anatomy of the nervous system—either gross anatomical differences or connectivity. Additional techniques were developed to see how the living brain functions.
Studying Brain Structure
The following techniques are used to analyze brain structure.
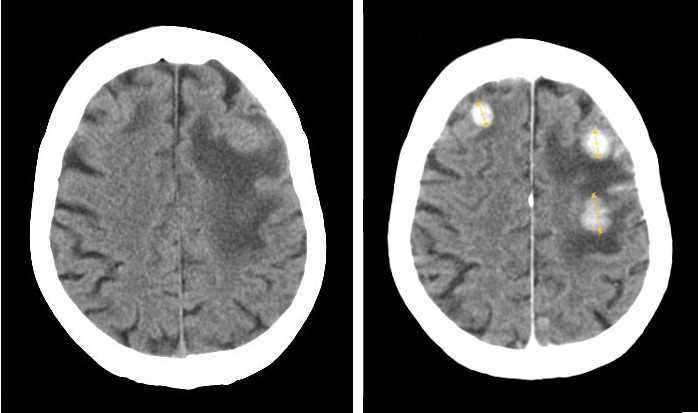
CT Scan
Example questions answered:
“Does the patient have a brain tumor and where is the brain tumor located?”
“Are the meninges intact?”
The CT scan relies on X-ray technology. X-rays are high energy beams of electromagnetic radiation that are capable of passing through many physical objects. Traditional two-dimensional X-rays, such as those used to image a broken bone or tooth decay, use radiographic film to detect where the X-rays get blocked. When an X-ray passes unimpeded, it causes the film to darken. But, wherever the X-rays are blocked, the film remains white. Therefore, material that is more dense (such as bone) appears as white, less dense material (such as the air surrounding the body or CSF) appears dark. Other tissue are some shade of gray in between.
The CT scan is essentially a three-dimensional X-ray that revolves around the person as they move through the scanner. Instead of using radiographic film, the CT scan uses a computer that detects the passage of X-rays, located directly across the emission source of the X-ray. Instead of a flat, two dimensional-image, the CT scan uses an X-ray gun that revolves around the person’s body as they advance slowly through a large circular hole. The computer is then able to compile the series of two-dimensional images and turn them into a three-dimensional reconstruction that can be used to see the brain from any projection. CT scans give us a spatial resolution of about 0.5 mm.
CT scans are generally used clinically to assess diagnostic changes over several days (such as before and after tumor removal or to determine if an intracranial bleed has healed), so temporal resolution is not a major consideration. As an anatomical analysis that can easily identify tissues of different density, it is great for identifying and diagnosing particular brain conditions. Brain tumors can be visualized in a CT scan, since they are identified by an increase in tissue density compared to normal brain tissue. Hydrocephalus, an abnormal and potentially deadly expansion of the CSF-filled ventricles, can be quickly identified by this analysis. Meningitis, an inflammation of the meninges, may present as increased contrast in the CT scan.
The big advantage of the CT scan is that it is noninvasive. You can use a CT scan in order to diagnose and identify the cause of a condition while a person is still alive, and hopefully work towards developing an intervention. It is also a relatively quick technique. A full-head CT scan takes only minutes, which allows for a rapid diagnosis of anatomical structures. However, X-rays are highly mutagenic. Prolonged exposure to X-rays dramatically increases the risk of developing various cancers, since X-rays interfere with the process of DNA replication. It is estimated that the radiation exposure in a single head CT scan is similar to the background exposure of X-rays in a few months. When a CT scan is prescribed, the diagnostic information gained from a CT scan is more important than the risks from increased radiation exposure.
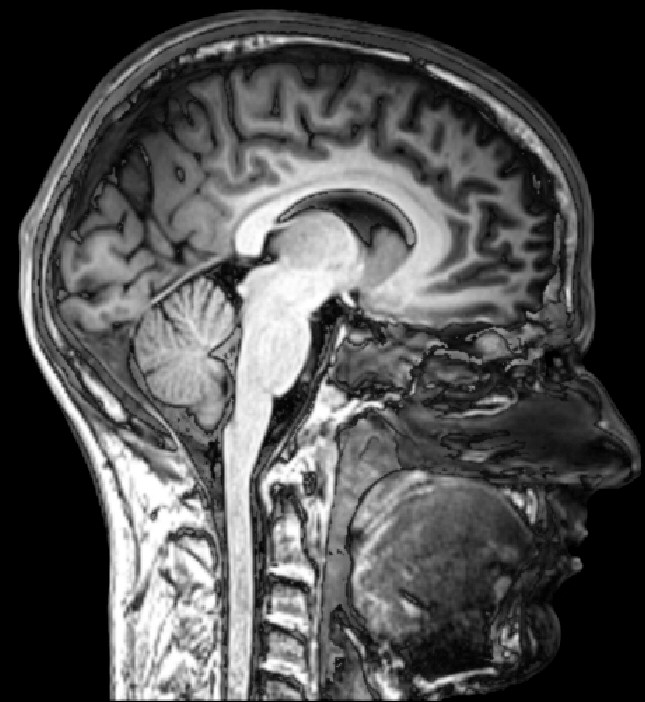
Magnetic Resonance Imaging (MRI)
Example questions answered:
“Are their structural abnormalities in a brain structure?”
“What are the measurements of a brain structure?”
Magnetic resonance imaging (MRI) is used for imaging brain structures. An MRI is able to more clearly differentiate between different types of tissues with high resolution. It can be used in place of CT scan for visualization of structures that are very small or need finer detail than can be seen with a CT scan.
The MRI machine is a circular tunnel through which a person on a table moves. As the person moves through the scanner, an extremely powerful magnet revolves around their head. The power of a typical magnet used in a hospital MRI may be as powerful as 10,000 gauss (1 Tesla)—strong enough to lift a car. The more powerful fMRI machines can be as powerful as 100,000 gauss (10 Tesla). The stronger the magnets, the better the spatial resolution that the machine can produce (our current best spatial resolution is on the order of millimeters).
MRI technology detects and quantifies the movement of water molecules, which moves differently in gray matter than white matter. The movement of a water molecule in biological tissue is not completely random, largely because the brain is made up of heterogeneous tissue.
Although the technique has a great capacity for analyzing brain structure, the nature of the machine itself presents limitations. The machine can also be very loud, which is not trivial if you are interested in using this technology on younger patients. The use of a tremendously powerful magnetic field presents a different set of limitations. At the risk of severe injury or death, the patient entering the scanner cannot have any magnetosensitive implants, such as metallic aneurism clips, intrauterine devices, or shrapnel. Even older generation tattoos have trace amounts of metal that cause burns when exposed to the magnets of the MRI machine.
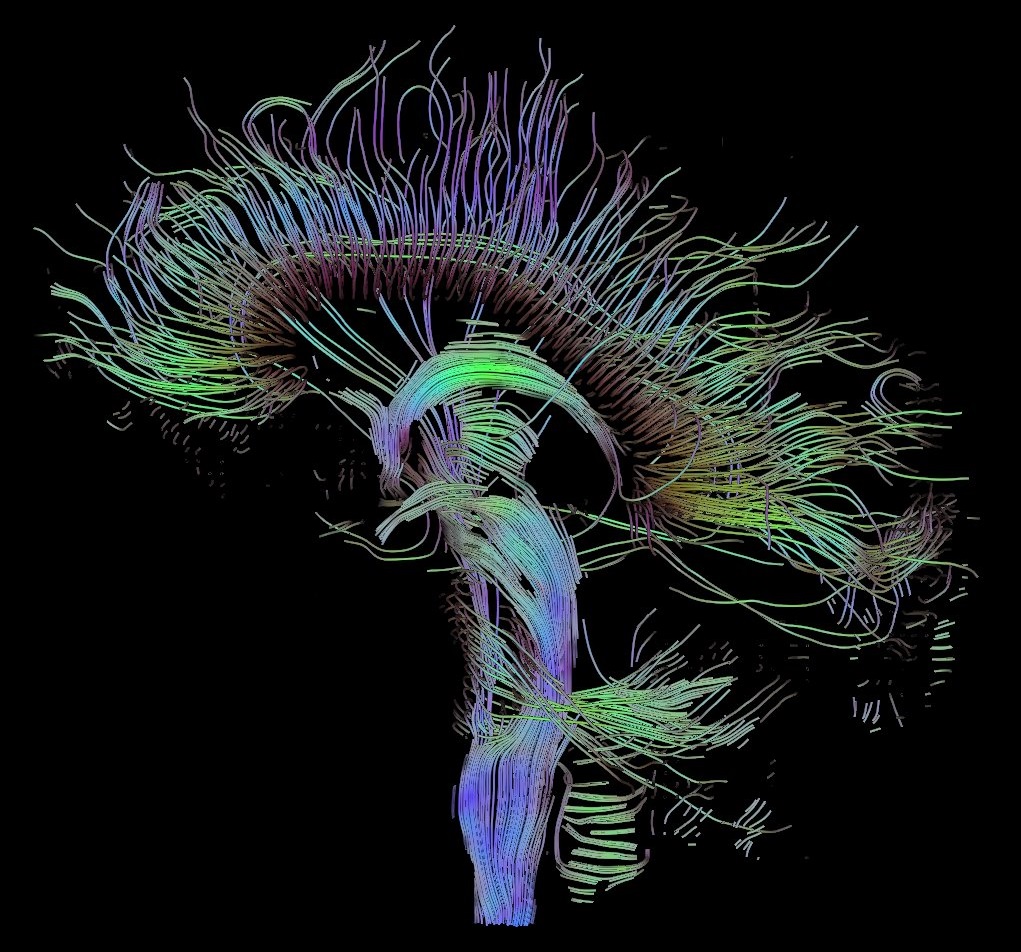
Diffusion tensor imaging (DTI)
Example questions answered:
“Is the volume of the white matter tract medial longitudinal fasciculus important for normal language processing?”
“Does spinal cord compression cause neurological deficits?”
While a CT scan is great for detecting gross anatomical anomalies like tumors or intracranial bleeding, it has a difficult time with subtle anatomical changes like differences between gray matter and white matter tracts. A technique for identifying these differences was proposed in 1994, called diffusion tensor imaging (DTI).
DTI quantifies white matter because of the morphological features of white matter. More specifically, DTI uses MRI technology to detect and quantify the movement of water molecules, which move differently in gray matter than white matter. The movement of a water molecule in biological tissue is not completely random, largely because the brain is made up of heterogeneous tissue. White matter is very different from gray matter. A water molecule is more easily able to diffuse along the same direction as a tract of white matter but has a difficult time moving perpendicularly across such tissue. When looking at DTI images, they will have coloring added to the figure to show the different white matter tracts.
Axonal projections are directional, with the soma at one end and the axon terminal at the other. One of the shortcomings of DTI is that it cannot give us information about the directionality of the axonal projections.
Studying Brain Function
The following techniques are used to study brain function.
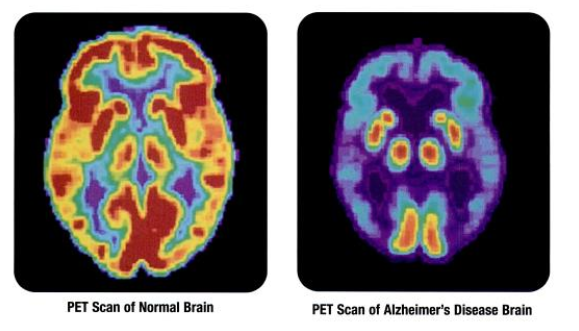
Positron emission tomography (PET scan)
Example questions answered:
“Which areas of the brain decrease in activity when a person experiences mild cognitive impairment?”
“Do drug-dependent people have a high density of opioid receptors?”
The positron emission tomography (PET) scan is an application of nuclear medicine best known for its applications in the medical setting for the diagnosis of cancer. Before the PET scan, a radioactive compound called a tracer is injected into the bloodstream. The PET scanner itself is a large circular device that looks similar to the CT scanner. The tracer is chemically unstable, and it produces a signal within the body that can be detected by the PET scanner as the person moves through the machine. A common tracer is a radioactive analog of glucose. Areas of the brain that are active will metabolize glucose for energy. Therefore, when an area of the brain increases in energetic demand, that change can be detected by identifying the increase in glucose movement.
PET scans can be effective at diagnosing and identifying the location of tumors in the nervous system. It also provides an overall picture of brain activity, which may be useful in diagnosing disorders of cognitive deficits, like dementia associated with Alzheimer’s disease. PET scans have also been used to image the activity of specific brain areas as a person performs behavioral tasks, but this use of PET scan has largely been replaced by functional magnetic resonance imaging. Another application of PET scanning is to visualize levels of receptors in vivo.
When looking at PET images, they will have coloring added to the figure to show where, anatomically, activity in the brain has increased or decreased. By convention, many times an increase in brain activity is depicted with warm colors (yellow, orange, red) whereas a decrease in brain activity is depicted with cool colors (blue, purple).
The downside of the PET scan as a diagnostic tool is similar to a limitation of the CT scan. A person is exposed to radioactive compounds and gamma wave radiation, which are potentially mutagenic. In images produced by a PET scan, it is often difficult to identify boundaries between tissue, even between dramatically different internal organs. To make up for this deficit, PET scans are frequently performed simultaneously with an anatomical analysis like a CT scan. PET scans generally have very poor spatial and temporal resolution.
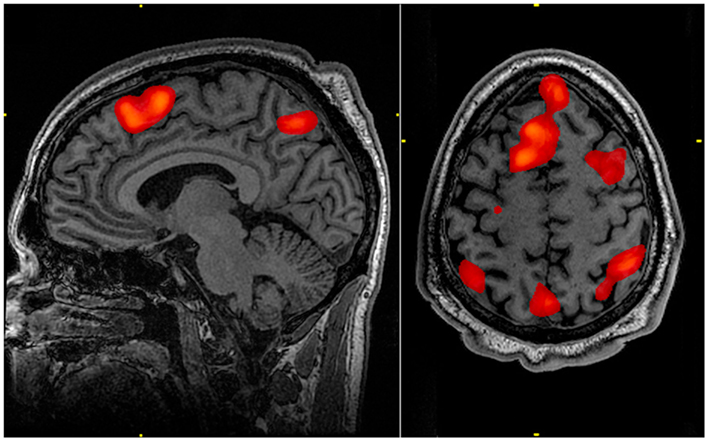
Functional magnetic resonance imaging (fMRI)
Example questions answered:
“Do neurons in the right hemisphere cingulate gyrus increase in activity when a person sees their loved ones?”
“Which areas of the brain change in activity when a person is planning a motor action?”
The functional magnetic resonance imaging (fMRI) technique is probably the most well-known method of studying brain activity. Because fMRI can be performed while a person is engaged in a task, many research studies use fMRI as a means to correlate behavior with activity patterns in specific parts of the brain.
fMRI measures differences in blood flow and oxygen levels. Like the PET scan, the fMRI hinges on the idea that more active areas of the brain have different metabolic demands than less active areas of the brain. When there is more activity in one area of the brain, the neurons in that area need more oxygen. This change in blood flow is detected by the fMRI. The main reason fMRI is useful in so many research applications is that you are able to visualize brain activity real-time during the performance of complex behavioral tasks. You can present specific visual stimuli to a person in an fMRI scan and evaluate which parts of the brain change in activity. For example, seeing pictures of faces causes increased blood flow into the fusiform face area. You can ask a person to perform a gambling task and evaluate the areas of the prefrontal lobe that are responsive to risk taking.
When looking at fMRI images, they will have coloring added to the figure to show anatomically where activity in the brain has increased or decreased. By convention, many times an increase in brain activity is depicted with warm colors (yellow, orange, red) whereas a decrease in brain activity is depicted with cool colors (blue, purple).
The limitations introduced with MRI earlier are the same for fMRI. In addition, due to the small tube, it can be difficult to study anxiety with endangering the patient. Further, the data collected by fMRI can be very difficult to analyze and are frequently subject to false positives. fMRI also assumes that increased blood flow is directly correlated with the amount of neural activity, which may not always be the case.
Key Takeaways
- CT scans, MRI scans, DTI are used to visualize brain structures
- PET scans and fMRI scans are used to visualize brain function
Test Yourself!
Attributions
Portions of this chapter were remixed and revised from the following sources:
- Open Neuroscience Initiative by Austin Lim. The original work is licensed under a Creative Commons Attribution-NonCommercial 4.0 International License.
Media Attributions
- CT scan © Jmarchn adapted by Valerie Hedges is licensed under a CC BY-NC-SA (Attribution NonCommercial ShareAlike) license
- MRI scan © deradrian adapted by Valerie Hedges is licensed under a CC BY-SA (Attribution ShareAlike) license
- DTI image © Thomas Schultz is licensed under a CC BY-SA (Attribution ShareAlike) license
- PET scan © Health and Human Services Department, National Institutes of Health, National Institute on Aging : p.24 is licensed under a Public Domain license
- fMRI scan © John Graner is licensed under a Public Domain license
Neurodegenerative disease that causes cell death and dementia
Performing an experiment in an intact, living organism, whether human or nonhuman
