Images of Animations

Chapter 1

Animation 1

Illustrated neuron highlighting the movement of an action potential down the axon hillock and axon. Details in caption.
Figure 1.11. The action potential is a brief but significant change in electrical potential across the membrane. The membrane potential will move from a negative, resting membrane potential, shown here as -65 mV, and will rapidly become positive and then rapidly return to rest during an action potential. The action potential moves down the axon beginning at the axon hillock. When it reaches the synaptic terminal, it causes the release of chemical neurotransmitter. ‘Action Potential Propagation’ by Casey Henley is licensed under a Creative Commons Attribution Non-Commercial Share-Alike (CC-BY-NC-SA) 4.0 International License.

Chapter 2

Animation 1

Illustrated membrane with channels. Ions can only pass through open channels.
Figure 2.3. When ion channels in the membrane are closed, ions cannot move into or out of the neuron. Ions can only cross the cell membrane when the appropriate channel is open. For example, only sodium can pass through open sodium channels. The dotted, blue channels represent sodium channels; the striped, green channels represent potassium channels; the solid yellow channels represent chloride channels. ‘Ion Movement’ by Casey Henley is licensed under a Creative Commons Attribution Non-Commercial (CC-BY-NC) 4.0 International License.

Animation 2

Concentration and electrical gradients drive ion movement. Details in caption.
Figure 2.4. Concentration and electrical gradients drive ion movement. Ions diffuse down concentration gradients from regions of high concentration to regions of low concentration. Ions also move toward regions of opposite electrical charge. ‘Gradients’ by Casey Henley is licensed under a Creative Commons Attribution Non-Commercial (CC-BY-NC) 4.0 International License.

Animation 3

Illustrated membrane with open channels. The ion present is at equilibrium. Details in caption.
Figure 2.5. When an ion is at equilibrium, which occurs when the concentration and electrical gradients acting on the ion balance, there is no net movement of the ion. The ions continue to move across the membrane through open channels, but the ion flow into and out of the cell is equal . In this animation, the membrane starts and ends with seven positive ions on each side even though the ions move through the open channels. ‘Ion Equilibrium’ by Casey Henley is licensed under a Creative Commons Attribution Non-Commercial (CC-BY-NC) 4.0 International License.

Chapter 3

Animation 1

Four panel illustration of sodium movement as a result of electrochemical gradients. Details in caption.
Figure 3.7. A) At rest, both the concentration and electrical gradients for sodium point into the cell. As a result, sodium flows in. As sodium enters, the membrane potential of the cell decreases and becomes more positive. B) As the membrane potential changes, the electrical gradient decreases in strength, and after the membrane potential passes 0 mV, the electrical gradient will point outward, since the inside of the cell is more positively charged than the outside. C) The ions will continue to flow into the cell until equilibrium is reached. An ion will be at equilibrium when its concentration and electrical gradients are equal in strength and opposite in direction. The membrane potential of the neuron at which this occurs is the equilibrium potential for that ion. Sodium’s equilibrium potential is approximately +60 mV. The dotted, blue channels represent sodium channels; the striped, green channels represent potassium channels; the solid yellow channels represent chloride channels.‘ Sodium Gradients’ by Casey Henley is licensed under a Creative Commons Attribution Non-Commercial Share-Alike (CC BY-NC-SA) 4.0 International License.

Chapter 4

Animation 1

Illustrated neuron membrane at rest with illustrated ion channels. Potassium channels are open; other channels are closed. Arrows indicated potassium ions move out of the cell through the open channels. The equilibrium potential of potassium is -80 mV.
Figure 4.3. Electrochemical gradients drive potassium out of the cell, removing positive charge, making the cell’s membrane potential more negative, in the direction of potassium’s equilibrium potential. The dotted, blue channels represent sodium leak channels; the striped, green channels represent potassium leak channels; the solid yellow channels represent chloride leak channels. ‘Potassium at Rest’ by Casey Henley is licensed under a Creative Commons Attribution Non-Commercial Share-Alike (CC BY-NC-SA) 4.0 International License.

Animation 2

Illustrated membrane with illustrated ion channels. Illustrated ions are on either side of the membrane. At rest, ore potassium ion channels are open compared to chloride or sodium. Arrows on the ion channels indicate many potassium ions flowing out of the cell, fewer chloride ions flowing out of the cell, and very few sodium ions flowing into the cell. Text reads, “Efflux of potassium makes membrane potential more negative. Efflux of chloride and influx of sodium make membrane potential more positive.”
Figure 4.4. The membrane is most permeable to potassium at rest, and this leads to potassium efflux. However, the membrane is also permeable to chloride and sodium, and the flow of these ions keep the resting membrane potential more positive than potassium’s equilibrium potential. The dotted, blue channels represent sodium leak channels; the striped, green channels represent potassium leak channels; the solid yellow channels represent chloride leak channels. ‘Ion Flow at Rest’ by Casey Henley is licensed under a Creative Commons Attribution Non-Commercial Share-Alike (CC BY-NC-SA) 4.0 International License.

Animation 3

Five panel illustration showing sodium-potassium pump function. Details in caption.
Figure 4.5. The sodium-potassium pump is embedded in the cell membrane and uses ATP to move sodium out of the cell and potassium into the cell, maintaining the electrochemical gradients necessary for proper neuron functioning. A) Three intracellular sodium ions enter the pump. B) ATP is converted to ADP, which leads to a conformational change of the protein, closing the intracellular side and opening the extracellular side. C) The sodium ions leave the pump while two extracellular potassium ions enter. D) The attached phosphate molecule then leaves, causing the pump to again open toward the inside of the neuron. E) The potassium ions leave, and the cycle begins again. ‘Sodium-Potassium Pump’ by by Casey Henley is licensed under a Creative Commons Attribution Non-Commercial Share-Alike (CC BY-NC-SA) 4.0 International License.

Chapter 5

Animation 1

A stimulus to the neuron will cause ion channels to open and allow ion flow. Details in caption.
Figure 5.3. Top panel: A stimulus can cause ion channels in the membrane of the cell body or dendrites to open. Bottom panel: The open ion channels allow ion flow across the membrane. The dotted, blue channels represent sodium channels; the striped, green channels represent potassium channels; the solid yellow channels represent chloride channels. ‘Postsynaptic Ion Flow’ by Casey Henley is licensed under a Creative Commons Attribution Non-Commercial Share-Alike (CC BY-NC-SA) 4.0 International License.

Animation 2

Illustrated membrane showing sodium ion movement into the cell. Details in caption.
Figure 5.4. When a stimulus opens sodium channels, sodium rushes into the cell because the equilibrium potential of sodium is +60 mV. This causes an excitatory depolarization called an excitatory postsynaptic potential (EPSP). After the stimulus, the ion channels close, and the membrane potential returns to rest. The dotted, blue channels represent sodium channels; the striped, green channels represent potassium channels; the solid yellow channels represent chloride channels. ‘EPSP’ by Casey Henley is licensed under a Creative Commons Attribution Non-Commercial Share-Alike (CC BY-NC-SA) 4.0 International License.

Animation 3

Illustrated membrane showing chloride ion movement into the cell causing an IPSP. Details in caption.
Figure 5.5. When a stimulus opens chloride channels, and the resting membrane potential is more positive than chloride’s equilibrium potential of -65 mV, chloride rushes into the cell. This causes an inhibitory hyperpolarization called an inhibitory postsynaptic potential (IPSP). After the stimulus, the ion channels close, and the membrane potential returns to rest. The dotted, blue channels represent sodium channels; the striped, green channels represent potassium channels; the solid yellow channels represent chloride channels. ‘IPSP’ by Casey Henley is licensed under a Creative Commons Attribution Non-Commercial Share-Alike (CC BY-NC-SA) 4.0 International License.

Animation 4

Illustrated membrane showing chloride ion movement at equilibrium. Details in caption.
Figure 5.6. If the cell is at rest at chloride’s equilibrium potential, when a stimulus opens the chloride channels, there will be no net movement of chloride in either direction because chloride will be at equilibrium. Since there is no net movement, there will also be no change in membrane potential because there is an equal amount of ion flow into and out of the cell. The dotted, blue channels represent sodium channels; the striped, green channels represent potassium channels; the solid yellow channels represent chloride channels. ‘IPSP at Equilibrium’ by Casey Henley is licensed under a Creative Commons Attribution Non-Commercial Share-Alike (CC BY-NC-SA) 4.0 International License.

Animation 5

Illustrated membrane showing chloride efflux causing an inhibitory depolarization. Details in caption.
Figure 5.7. If the cell is at rest at chloride’s equilibrium potential, when a stimulus opens the chloride channels, chloride will leave the cell, removing its negative charge. This causes a depolarization in the membrane potential, but it is still inhibitory since chloride movement will try to keep the cell near -65 mV. The dotted, blue channels represent sodium channels; the striped, green channels represent potassium channels; the solid yellow channels represent chloride channels.‘Inhibitory Depolarization’ by Casey Henley is licensed under a Creative Commons Attribution Non-Commercial Share-Alike (CC BY-NC-SA) 4.0 International License.

Animation 6

Multiple excitatory stimuli lead to summated EPSPs. Details in caption.
Figure 5.8. Excitatory stimuli that occur quickly in succession lead to summation of EPSPs. This leads to increased depolarization of the membrane potential compared to a single EPSP. The dotted, blue channels represent sodium channels; the striped, green channels represent potassium channels; the solid yellow channels represent chloride channels. ‘Summated EPSPs’ by Casey Henley is licensed under a Creative Commons Attribution Non-Commercial Share-Alike (CC BY-NC-SA) 4.0 International License.

Animation 7

When an IPSP and EPSP occur simultaneously, the magnitude of the depolarization decreases. Details in caption.
Figure 5.9. When an inhibitory input and an excitatory input stimulate a postsynaptic neuron at the same time, chloride and sodium channels open. Due to the equilibrium potentials of the two ions, both will flow into the cell. Sodium tries to depolarize the cell, whereas chloride tries to keep the cell near rest. The dotted, blue channels represent sodium channels; the striped, green channels represent potassium channels; the solid yellow channels represent chloride channels. ‘EPSP and IPSP Ion Flow’ by Casey Henley is licensed under a Creative Commons Attribution Non-Commercial Share-Alike (CC BY-NC-SA) 4.0 International License.

Chapter 6

Animation 1

Illustrated neuron highlighting the movement of an action potential down the axon hillock and axon. Details in caption.
Animation 6.9. The action potential moves down the axon beginning at the axon hillock. The action potential moving down a myelinated axon will jump from one Node of Ranvier to the next. This saltatory conduction leads to faster propagation speeds than when no myelin in present. When the action potential reaches the synaptic terminal, it causes the release of chemical neurotransmitter. ‘Action Potential Propagation’ by Casey Henley is licensed under a Creative Commons Attribution Non-Commercial Share-Alike (CC-BY-NC-SA) 4.0 International License.

Animation 2

Illustrated membrane showing voltage-gated channels opening at threshold. Details in caption.
Figure 6.10. A. As EPSPs summate, a result of ion movement not shown in the figure, the cell’s membrane potential will depolarize. B. Reaching threshold causes voltage-gated ion channels to open. Once the channels are open, ions will move toward equilibrium. In the figure, sodium ions flow inward. The dotted, blue channels represent voltage-gated sodium channels; the striped, green channels represent voltage-gated potassium channels; the solid yellow channels represent chloride channels. ‘Voltage-Gated Channel’ by Casey Henley is licensed under a Creative Commons Attribution Non-Commercial Share-Alike (CC-BY-NC-SA) 4.0 International License.

Animation 3

Action potential graph highlighting the rising phase and open voltage-gated sodium channels. Details in caption.
Figure 6.11. Voltage-gated sodium channels open once the cell’s membrane potential reaches threshold. The rapid influx of sodium results in a large depolarization called the rising phase. The dotted, blue channels represent voltage-gated sodium channels; the striped, green channels represent voltage-gated potassium channels; the solid yellow channels represent chloride channels. ‘Rising Phase’ by Casey Henley is licensed under a Creative Commons Attribution Non-Commercial Share-Alike (CC-BY-NC-SA) 4.0 International License.

Animation 4

Action potential graph highlighting the falling phase, inactivated sodium channels, and open voltage-gated potassium channels. Details in caption.
Figure 6.12. After approximately 1 msec, the voltage-gated sodium channels inactivate, which prevents any further ion flow into the cell. Although the voltage-gated potassium channels are activated in response to the cell reaching threshold, their opening is delayed and occurs alone with the sodium channel inactivation. This allows an efflux of potassium ions, which causes the repolarization of the falling phase. The dotted, blue channels represent voltage-gated sodium channels; the striped, green channels represent voltage-gated potassium channels; the solid yellow channels represent chloride channels. ‘Falling Phase” by Casey Henley is licensed under a Creative Commons Attribution Non-Commercial Share-Alike (CC-BY-NC-SA) 4.0 International License.

Animation 5

Action potential graph highlighting the undershoot, de-inactivated sodium channels, and open voltage-gated potassium channels. Details in caption.
Figure 6.13. Once the cell’s membrane potential repolarizes, the voltage-gated sodium channels de-inactivate and return to their closed state. The voltage-gated potassium channels remain open long enough for the undershoot to occur as potassium continues to flow out of the cell. The dotted, blue channels represent voltage-gated sodium channels; the striped, green channels represent voltage-gated potassium channels; the solid yellow channels represent chloride channels. ‘Undershoot’ by Casey Henley is licensed under a Creative Commons Attribution Non-Commercial Share-Alike (CC-BY-NC-SA) 4.0 International License.

Animation 6

Action potential graph highlighting the return to resting membrane potential and the sodium-potassium pump. Details in caption.
Figure 6.14. Once the voltage-gated potassium channels close, the sodium-potassium pump will work to re-establish the electrochemical gradients and return the cell to its resting membrane potential. ‘Return to Rest’ by Casey Henley is licensed under a Creative Commons Attribution Non-Commercial Share-Alike (CC-BY-NC-SA) 4.0 International License.

Animation 7

Illustrated axon demonstrating saltatory conduction. Details in caption.
Figure 6.15. A) A voltage change that reaches threshold will cause voltage-gated sodium channels to open in the axonal membrane. The influx of sodium causes the rising phase of the action potential, but the ion flow also depolarizes nearby axon regions. B) As the depolarization reaches threshold, the action potential moves down the axon. The dotted, blue channels represent voltage-gated sodium channels; the striped, green channels represent voltage-gated potassium channels. ‘Action Potential Movement’ by Casey Henley is licensed under a Creative Commons Attribution Non-Commercial Share-Alike (CC-BY-NC-SA) 4.0 International License.

Animation 8

Illustrated axon demonstrating saltatory conduction. Details in caption.
Figure 6.16. The action potential moves down an unmyelinated axon like a wave, opening voltage-gated channels along the length of the axon. In a myelinated axon, though, the action potential is able to skip portions of the axon that are covered by the myelin; the action potential jumps from node to node and travels further down the axon in the same amount of time. The dotted, blue channels represent voltage-gated sodium channels; the striped, green channels represent voltage-gated potassium channels. ‘Action Potential Speed’ by Casey Henley is licensed under a Creative Commons Attribution Non-Commercial Share-Alike (CC-BY-NC-SA) 4.0 International License.

Chapter 7

Animation 1

Illustrated axon, membrane potential graph, and ion flow graph showing voltage-gated sodium action during the voltage clamp experiment. Details in caption.
Figure 7.9. A) Clamping the cell at 0 mV will result in current being passed into the axon to depolarize the membrane potential. This depolarization is above threshold, so the voltage-gated ion channels in the membrane will be activated. B) Sodium will enter the axon through the open sodium channels. The voltage clamp equipment will inject current equal in strength and opposite in charge to the sodium influx in order to keep the membrane potential of the axon at 0 mV. The membrane potential will remain at 0 mV because the injected current offsets any change that would normally occur due to ion flow. ‘Voltage Clamp Sodium Flow’ by Casey Henley is licensed under a Creative Commons Attribution Non-Commercial Share-Alike (CC-BY-NC-SA) 4.0 International License.

Animation 2

Illustrated axon, membrane potential graph, and ion flow graph showing voltage-gated potassium action during the voltage clamp experiment. Details in caption.
Figure 7.10. The voltage-gated sodium channels will inactivate, and the potassium channels will open. Potassium will then flow out of the axon. Similar to the sodium influx, the voltage clamp equipment will inject current equal in strength and opposite in charge to the potassium efflux in order to keep the membrane potential of the axon at 0 mV. ‘Voltage Clamp Potassium Flow’ by Casey Henley is licensed under a Creative Commons Attribution Non-Commercial Share-Alike (CC-BY-NC-SA) 4.0 International License.

Chapter 8

Animation 1

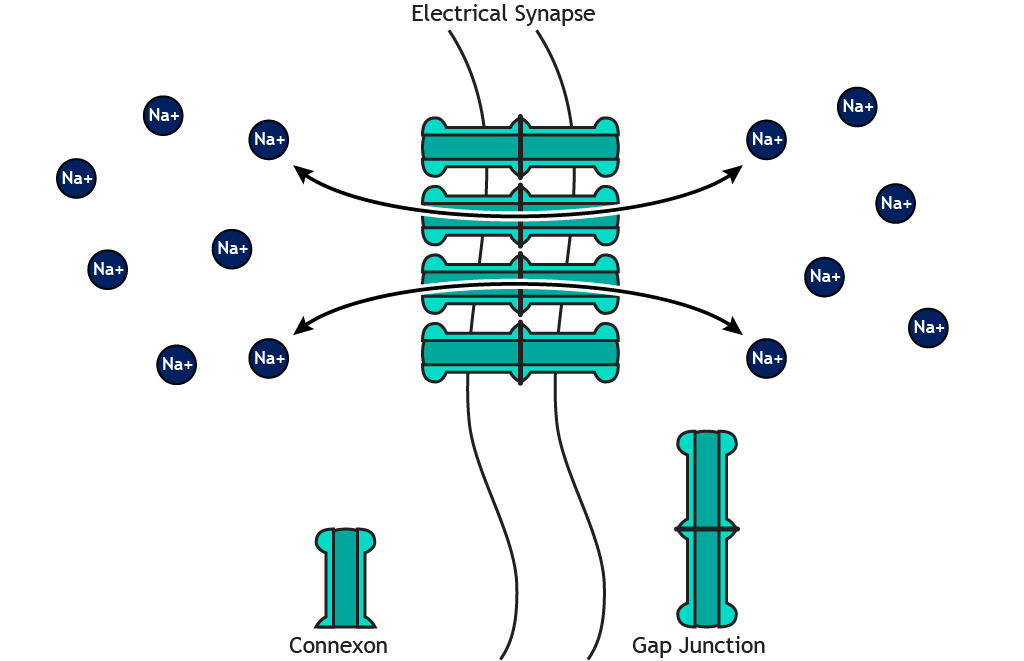
Illustrated electrical synapse with ion flow. Details in caption.
Figure 8.4. Membrane-bound proteins called connexons form gap junctions between presynaptic and postsynaptic neurons. This allows for direct exchange of ions between neurons. An action potential in the presynaptic neuron will cause an immediate depolarization of the postsynaptic membrane because the sodium ions will cross the membrane through the gap junctions. ‘Electrical Synapse – Ion Flow’ by Casey Henley is licensed under a Creative Commons Attribution Non-Commercial Share-Alike (CC BY-NC-SA) 4.0 International License.

Animation 2

Illustrated electrical synapse with bidirectional ion flow. Details in caption.
Figure 8.5. Since an electrical synapse is a direct, physical connection between two neurons, ions are able to flow either direction across the gap junction. ‘Bidirectional Electrical Synapse’ by Casey Henley is licensed under a Creative Commons Attribution Non-Commercial Share-Alike (CC BY-NC-SA) 4.0 International License.

Animation 3

Illustrated electrical synapse showing small molecules crossing the membrane. Details in caption.
Figure 8.6. Gap junctions are large enough to allow the flow of small cellular molecules like ATP or second messengers. ‘Electrical Synapse – Small Molecules’ by Casey Henley is licensed under a Creative Commons Attribution Non-Commercial Share-Alike (CC BY-NC-SA) 4.0 International License.

Animation 4

Illustrated synapse showing neurotransmitter release. Details in caption.
Figure 8.7 When an action potential arrives in the presynaptic terminal, neurotransmitters are released into the synaptic cleft where they can act on neurotransmitter receptors in the postsynaptic membrane. ‘Chemical Synapse – Neurotransmitter Release’ by Casey Henley is licensed under a Creative Commons Attribution Non-Commercial Share-Alike (CC BY-NC-SA) 4.0 International License.

Chapter 10

Animation 1

Illustrated neuron highlighting the movement of an action potential down the axon hillock and axon. Details in caption.
Animation 10.5. The action potential is a brief but significant change in electrical potential across the membrane. The membrane potential will move from a negative, resting membrane potential, shown here as -65 mV, and will rapidly become positive and then rapidly return to rest during an action potential. The action potential moves down the axon beginning at the axon hillock. When it reaches the synaptic terminal, it causes the release of chemical neurotransmitter. ‘Action Potential Propagation’  by Casey Henley is licensed under a Creative Commons Attribution Non-Commercial Share-Alike (CC-BY-NC-SA) 4.0 International License.

Animation 2

Illustrated terminal showing calcium influx prior to transmitter release. Details in caption.
Figure 10.6. A) An action potential causes an influx of sodium in the terminal. B) The depolarization opens voltage-gated calcium channels, and calcium ions flow into the terminal down their electrochemical gradient. The blue, dotted channels represent voltage-gated sodium channels, and the purple, striped channels represent voltage-gated calcium channels. ‘Terminal Calcium Influx’ by Casey Henley is licensed under a Creative Commons Attribution Non-Commercial Share-Alike (CC-BY-NC-SA) 4.0 International License.

Animation 3

Snaptotagmin interacting with SNARE proteins in presence of calcium. Details in caption.
Figure 10.7. A) Calcium enters the cell when the voltage-gated channels open. B) In the presence of calcium, synaptotagmin, a protein bound to the vesicular membrane interacts with the SNARE proteins. The purple, striped channels represent voltage-gated calcium channels. ‘Synaptotagmin’ by Casey Henley is licensed under a Creative Commons Attribution Non-Commercial Share-Alike (CC-BY-NC-SA) 4.0 International License.

Animation 4

Illustrated vesicle fusing with membrane and releasing transmitter. Details in caption.
Figure 10.8. Once the synaptotagmin-SNARE protein complex forms, the synaptic vesicle membrane fuses with the terminal membrane, and the neurotransmitters are released into the synaptic cleft through exocytosis. The purple, striped channels represent voltage-gated calcium channels. ‘Transmitter Exocytosis’ by Casey Henley is licensed under a Creative Commons Attribution Non-Commercial Share-Alike (CC-BY-NC-SA) 4.0 International License.

Chapter 11

Animation 1

Illustrated channels showing the difference between voltage-gating and ligand-gating. Details in caption.
Figure 11.2. A) Ionotropic receptors, also called ligand-gated channels, are ion channels that are opened by the binding of neurotransmitters. Voltage-gated channels are opened by the membrane potential of the cell reaching threshold. B) Both types of channels allow ions to diffuse down their electrochemical gradient. The lined, teal channels represent glutamate receptors; the solid yellow channels represent GABA receptors; the dotted, blue channels represent voltage-gated sodium channels. ‘Ion Channel Gating’ by Casey Henley is licensed under a Creative Commons Attribution Non-Commercial Share-Alike (CC-BY-NC-SA) 4.0 International License.

Animation 2

Illustrated channels showing specificity of ionotropic receptors to their specific neurotransmitter. Details in caption.
Figure 11.3. Since neurotransmitter receptors can only bind specific neurotransmitters. glutamate binds to (A) and opens (B) glutamate receptors but has no effect on GABA receptors. The lined, teal channels represent glutamate receptors; the solid yellow channels represent GABA receptors. ‘Ligand and Receptor’ by Casey Henley is licensed under a Creative Commons Attribution Non-Commercial Share-Alike (CC-BY-NC-SA) 4.0 International License.

Animation 3

Illustrated AMPA and kainite channels showing sodium and potassium movement. Details in caption.
Figure 11.4. AMPA and kainate glutamate receptors are non-selective ion channels that allow both sodium and potassium to flow across the membrane. When glutamate binds, sodium flows in and potassium flows out. The lined, teal channel represents AMPA receptors; the checkered, teal channel represents kainate receptors. ‘AMPA and Kainate’ by Casey Henley is licensed under a Creative Commons Attribution Non-Commercial Share-Alike (CC-BY-NC-SA) 4.0 International License.

Animation 4

NMDA receptor gating. Details in caption.
Figure 11.5. NMDA receptors are opened by a combination of glutamate binding and a voltage trigger. A) At low levels of stimulation when the the membrane potential is near rest and below the NMDA receptor voltage threshold, a magnesium ion blocks the open NMDA receptor channel preventing ion flow. Ions can flow through open AMPA receptors, which begins to depolarize the membrane. B) Once the NMDA receptor voltage threshold has been reached, the magnesium ion is expelled from the channel, allowing sodium, potassium, and calcium to cross the membrane. The lined, teal channels represent AMPA receptors; the dotted, violet channels represent NMDA receptors. ‘AMPA and NMDA’ by Casey Henley is licensed under a Creative Commons Attribution Non-Commercial Share-Alike (CC-BY-NC-SA) 4.0 International License.

Animation 5

GABA and glycine receptors are chloride channels. Details in caption.
Figure 11.6. GABA and glycine are inhibitory receptors that are selective to chloride. The solid yellow channel represents a GABA receptor; the patterned, yellow channel represents a glycine receptor. ‘GABA and Glycine’ by Casey Henley is licensed under a Creative Commons Attribution Non-Commercial Share-Alike (CC-BY-NC-SA) 4.0 International License.

Animation 6

Sodium flows into the cell via voltage-gated sodium channels to reach equilibrium. Details in caption.
Figure 11.7. Ions move through open voltage-gated channels trying to reach equilibrium. As the ions cross the membrane, the neuron’s membrane potential moves closer to the ion’s equilibrium potential. In the figure, a voltage-gated sodium channel opens, and sodium flows in until the membrane potential equals approximately +60 mV, sodium’s equilibrium potential. The blue, dotted channel represents a voltage-gated sodium channel. ‘Equilibrium Potential’ by Casey Henley is licensed under a Creative Commons Attribution Non-Commercial Share-Alike (CC-BY-NC-SA) 4.0 International License.

Animation 7

Chloride moves through GABA receptors to reach the reversal potential. Details in caption.
Figure 11.8. Ions move through open ligand-gated channels trying to reach equilibrium. As the ions cross the membrane, the neuron’s membrane potential moves closer to the receptor’s reversal potential. When the ionotropic receptor only increases permeability for one ion, the receptor’s reversal potential is the same as the ion’s equilibrium potential. In the animation, a GABA receptor open, and chloride flows in until the membrane potential equals approximately -65 mV, GABA’s reversal potential and chloride’s equilibrium potential. The yellow, checkered channel represents a GABA receptor. ‘GABA Reversal Potential’ by Casey Henley is licensed under a Creative Commons Attribution Non-Commercial Share-Alike (CC-BY-NC-SA) 4.0 International License.

Animation 8

Sodium and potassium flow through a glutamate receptor to reach the reversal potential. Details in caption.
Figure 11.9. The reversal potential of an ionotropic receptor that is not selective to one ion will fall between the equilibrium potentials of the permeable ions. Glutamate receptors allow the flow of both sodium and potassium ions, so the reversal potential for the receptor is approximately 0 mV. More sodium will flow into the cell than potassium flows out, resulting in a depolarization of the membrane. The line, teal channel represents a glutamate receptor. ‘Glutamate Reversal Potential – Rest’ by Casey Henley is licensed under a Creative Commons Attribution Non-Commercial Share-Alike (CC-BY-NC-SA) 4.0 International License.

Animation 9

At the reversal potential, the flow of ions into and out of the cell are equal. Details in caption.
Figure 11.10. At the reversal potential, there is no net ion flow in either direction. An equal number of sodium ions enter the cell as potassium ions leave. Since there is no change in voltage at the reversal potential, if the receptor remained open, the membrane potential would stay at 0 mV. ‘Glutamate Reversal Potential – 0 mV’ by Casey Henley is licensed under a Creative Commons Attribution Non-Commercial Share-Alike (CC-BY-NC-SA) 4.0 International License.

Chapter 12

Animation 1

Illustrated G-protein binding to G-protein coupled receptors. Details in caption.
Figure 12.5. A) Neurotransmitter binding to a G-protein-coupled receptor causes the inactivated G-protein complex to interact with the receptor. B) The GDP molecule is then exchanged for a GTP molecule, which activates the G-protein complex. ‘G-protein Binding’ by Casey Henley is licensed under a Creative Commons Attribution Non-Commercial Share-Alike (CC BY-NC-SA) 4.0 International License.

Animation 2

G-protein subunits can have separate effects. Details in caption.
Figure 12.6. A) Once activated, the G-protein complex will separate into the alpha-GTP subunit and the beta-gamma subunit. B) These subunits can stimulate or inhibit effector proteins within the cell. ‘G-protein Effects’ by Casey Henley is licensed under a Creative Commons Attribution Non-Commercial Share-Alike (CC BY-NC-SA) 4.0 International License.

Animation 3

Beta-gamma subunit can open ion channels. Details in caption.
Figure 12.7. Some GPCRs, like the muscarinic acetylcholine receptors in the heart, alter cellular permeability by opening ion channels. The activated beta-gamma subunit of the muscarinic receptor (A) opens GIRK potassium channels and allows the efflux of potassium (B). ‘Beta-Gamma Ion Channels’ by Casey Henley is licensed under a Creative Commons Attribution Non-Commercial Share-Alike (CC BY-NC-SA) 4.0 International License.

Animation 4

Adenylyl cyclase signaling pathway. Details in caption.
Figure 12.8. GPCRs that couple to the Gs alpha subunit initiate the adenylyl cyclase / cAMP pathway. The Gs subunit activates adenylyl cyclase, which then converts ATP to cAMP. cAMP binds to and activates protein kinase A (PKA), which phosphorylates proteins in the cell. ‘Adenylyl Cyclase Pathway’ by Casey Henley is licensed under a Creative Commons Attribution Non-Commercial Share-Alike (CC BY-NC-SA) 4.0 International License.

Animation 5

cAMP and PKA can open ion channels. Details in caption.
Figure 12.9. A) The adenylyl cyclase / cAMP pathway can alter many cellular functions. One example is that both cAMP and PKA can open ion channels. B) Like ligand-gated channels, there are also cAMP-gated channels, which open after cAMP binding. PKA is able to phosphorylate and modulate ion channel function by converting ATP to ADP. ‘Second Messenger Ion Channel Action’ by Casey Henley is licensed under a Creative Commons Attribution Non-Commercial Share-Alike (CC BY-NC-SA) 4.0 International License.

Animation 6

PKA can phosphorylate cellular proteins including transcription factors. Details in caption.
Figure 12.10. A) PKA can phosphorylate a number of proteins involved with neuron function. B) It can target proteins involved with neurotransmitter synthesis, packing, and release, or it can enter the nucleus and phosphorylate CREB, a transcription factor that can initiate gene transcription and protein synthesis. ‘PKA Targets’ by Casey Henley is licensed under a Creative Commons Attribution Non-Commercial Share-Alike (CC BY-NC-SA) 4.0 International License.

Animation 7

Phospholipase C signaling pathway. Details in caption.
Figure 12.11. A) The Gq G-protein subunit activates phospholipase C, which converts the phospholipid PIP2 in the cell membrane into DAG, another membrane-bound molecule, and IP3, a cytoplasmic molecule. B) DAG can interact with PKA, initiating phosphorylation of cellular proteins. IP3 opens calcium channels in the endoplasmic reticulum, allowing calcium to flow into the cytoplasm. C) Calcium, another second messenger can have many cellular effects. It can bind to calmodulin, which then activates CaMK, causing phosphorylation of more protein targets. ‘IP3-DAG Pathway’ by Casey Henley is licensed under a Creative Commons Attribution Non-Commercial Share-Alike (CC BY-NC-SA) 4.0 International License.

Chapter 19

Animation 1

Illustration of the photoreceptor membrane showing phototransduction in light. Details in caption.
Figure 19.16. A) In the dark, the photoreceptor is depolarized due to an influx of sodium and calcium through open ion channels that are gated by cGMP. The photoreceptor has high levels of cGMP when it is in the dark. Additionally, the opsin proteins, the G-protein transducin, and phosphodiesterase (PDE) are all inactivated. B) Light reaching the photoreceptor causes a conformational change in the opsin protein, which activates the G-protein transducing. Transducin activates phosphodiesterase (PDE), which converts cGMP to GMP. Without cGMP, the cation channels close, stopping the influx of positive ions. This results in a hyperpolarization of the cell. ‘Phototransduction’ by Casey Henley is licensed under a Creative Commons Attribution Non-Commercial Share-Alike (CC BY-NC-SA) 4.0 International License.

License

Icon for the Creative Commons Attribution-NonCommercial-ShareAlike 4.0 International License

Foundations of Neuroscience Copyright © 2021 by Casey Henley is licensed under a Creative Commons Attribution-NonCommercial-ShareAlike 4.0 International License, except where otherwise noted.

Share This Book