
Chapter 2: Spectroscopy: how we know what we know about the structure of matter
 Spectroscopy is the study of how energy (particularly electromagnetic radiation) and matter interact. By analyzing these interactions, we can infer a great deal of evidence about the structure of matter. In organic chemistry, spectroscopy allows us to determine the structure of products and reactants (and in some cases we can also get information about intermediates of reactions). By using spectroscopy of different kinds, we can gather evidence about reaction rates and from this information we can infer mechanisms of reactions. In this chapter, we will briefly review the background that you (probably) learned in general chemistry, and then we will move on to the various type of spectroscopy and discuss what each type can and cannot tell us about the structure of organic compounds.
From your earlier studies, you will recall that at the atomic/molecular level, the energies of atoms and molecules are quantized: that is, there are discrete, separate energy states with nothing in between. This applies not only to the energies of electrons, but also to the energies of vibration of bonds and rotation around bonds. Nuclear energies are also quantized. It is possible to switch from one energy state to another by absorbing or emitting an amount of electromagnetic energy (a photon) that corresponds to the energy difference between the two states. Photons with the energy that does not correspond to differences between two energy states are not absorbed or emitted, which means that we can use the energies of the photons absorbed or emitted to tell us about the energy differences between quantum states in atoms and molecules. The differences between these quantized energy levels is highly dependent on the identity and environment of the atoms and molecules, and therefore we can the photons emitted to identify particular species. For example, in isolated atoms the energy differences between levels often correspond to electromagnetic energy in the ultraviolet or visible. This results in the atomic absorption or emission spectra that allow us to determine what elements are present in (for example) stars, and interstellar space.
Interactions of electromagnetic radiation and electrons in molecules
Now we will extend this idea from atoms to molecules. Just as electrons occupy atomic orbitals in atoms, the electrons in molecules occupy molecular orbitals.
| A + hv [latex]\rightarrow[/latex] A* (excited state) [latex]\rightarrow[/latex] A (ground state) +hv |
As with atomic orbitals, electrons in molecular orbitals can absorb or release photons of a specific energy as they move from one molecular orbital to another. However, there is a significant difference between the absorption/emission process in isolated atoms (or ions) versus that of molecules. When an electron is promoted to a higher energy level in an atom, the product is an atom in an excited state—generally the excited atom (or ion) will decay back to the ground state by emitting a photon (↓). However, when an electron within a molecule is excited it moves (or is “promoted”) from its original molecular orbital to another. Now there are a number of different consequences that can occur. For example, if the electron absorbs a photon and is promoted from a bonding molecular orbital to an antibonding orbital, the result will be that the bond will break, since there is now no overall stabilizing interaction. 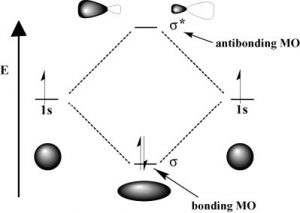 Consider H–H, which is the simplest possible molecule. The set of molecular orbitals for hydrogen includes a [latex]\sigma[/latex] (sigma) bonding and a [latex]\sigma[/latex] * antibonding orbital. In the ground (or lowest-energy) state, molecular hydrogen has a [latex]\sigma[/latex] bonding orbital containing both of the molecule’s electrons. If one of the bonding electrons absorbs a photon that has just the right amount of energy (the energy difference between the bonding and antibonding orbital) it will be promoted and move into the destabilized antibonding orbital—causing the bond between the atoms to break because there is now no overall bonding interaction. As you might imagine, if chemical bonds were susceptible to breaking merely by being exposed to low-energy electromagnetic radiation (such as that of visible light) the world would be a different (and rather boring) place. For example, life would not be possible since it depends upon the stability of molecules. In fact, the energy of the photons required to bring about bond-breaking is quite large.
 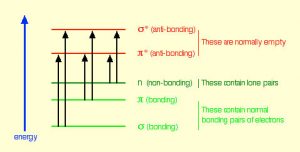 For example, the energy required to break an H-H bond (the bond energy) is 436 kJ/mol. If you calculate the wavelength of a photon that could deliver this amount of energy, the amount of energy required to break one H-H bond would be in the far UV section of the electromagnetic spectrum (~280nm). The typically strong covalent [latex]\sigma[/latex] (or single) bond requires quite high-energy photons to break them.
In fact, the Earth’s atmosphere blocks out most (>98%) high-energy (ultraviolet) photons and most biologically important molecules cannot absorb visible light, so that leaves us with the question of why is there a need for sunscreen, which filters out the UV A (400- 315 nm) and UV B (315-280 nm) photons. The answer is that a number of biological molecules contain more than simple sigma bonds. For example, most complex biological molecules also contain [latex]\pi[/latex] (pi) bonds and non-bonding electrons in addition to [latex]\sigma[/latex] bonds; transitions between these orbitals may be observed. The energy gaps between these different orbitals are quite are smaller than the [latex]\sigma - \sigma[/latex] * energy gap. Photons with enough energy to cause these electron transitions are present in sunlight. For example, a double bond typically involves both a [latex]\sigma[/latex] and a [latex]\pi[/latex] bond. Absorption of a photon that would promote an electron from a [latex]\pi[/latex] bonding orbital to a [latex]\pi[/latex] * anti-bonding orbital would have the effect of breaking the original pi bond. One way to represent this is shown here (→). 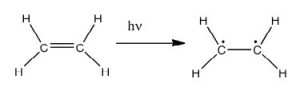 In this case, one of electrons that was in the pi bond is now in the high-energy pi* antibonding orbital and is far more reactive. Another way to think about it is that the electrons are now unpaired, and are much more likely to react to form a more stable entity.[1] An obvious way to regain stability is for the electron in the [latex]\pi[/latex] antibonding orbital to drop back down to the bonding energy level and emit a photon of the same energy, and in most cases this is what happens—ultimately causing no damage. (As we will see later, since double-bonds are rotationally constrained, another possible occurrence is that there can be rotation around the single [ [latex]\sigma[/latex] ] bond) and then reformation of the [latex]\pi[/latex] bond, leading to an isomer of the original alkene). However, in some instances, if there is another potentially reactive species in proximity, reactions between molecules (or in the case of biological macromolecules, between distinct regions of these molecules) can occur and cause problems. For example: most of us are aware that exposure to the sun causes skin damage that can lead to skin cancer. A major mechanism occurs in DNA where two thymidine bases are adjacent to one another. A UV photon can be absorbed by a pi bond in one thymine base. This broken pi bond (and resulting unpaired electron) is very reactive. It can react with a pi bond in an adjacent thymine leading to a new bond, a reaction that produces a four-membered carbon ring, known as a thymine dimer.
 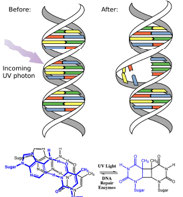 The DNA replication machinery cannot accurately replicate a sequence containing a thymine dimer, resulting in a change in DNA sequence—a mutation. Mutations of this type are a common early step in the generation of cancerous skin cells (carcinomas) and pigment cells (melanomas).[2]
A more benign example of photon absorption in biological systems underlies the mechanism by which we (and other organisms) detect light—that is how we can see things! While it was originally thought (at least by some) that vision involved rays emitted from eyes,[3] we now understand that to see we need to detect photons that are reflected or emitted by the objects around us. The process begins when the photons of light fall on cells known as photoreceptors. In our eyes, these cells are located within the retina: a sheet of cells that line the interior surface of the eye. Within a subset of retinal cells are a number of different types of molecules that contain pi bonds. These molecules are proteins known generically as opsins. An opsin is composed of a polypeptide (or apoprotein) that is covalently bound to another molecule, 11-cis-retinal.[4]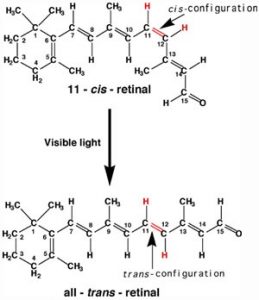
This molecule is derived from vitamin A (all-trans-retinal). The complex of apoprotein and retinal is the functional opsin protein. There are a number of different opsin components that influence the wavelength of the photons absorbed by the functional opsin protein. When a photon is absorbed, it promotes an electron from one of the retinal’s pi bonds to an antibonding orbital. Instead of reacting with another molecule, like thymine, there is a rotation around the remaining single (sigma) bond, and then the formation of a new pi bond, this leads to the isomerization of the original 11-cis form into the trans-isomer. This change in retinal shape influences the shape of the opsin protein which initiates a cascade of electrochemical events that carry signals to the rest of the brain (the retina is considered an extension of the brain) that are eventually recognized as visual input.
UV-Vis spectroscopy and chromophores – or why are carrots orange?
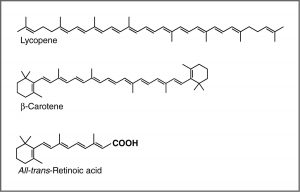
One common recommendation from doctors is that we eat plenty of highly colored fruits and vegetables. The compounds that give these foods their strong color have a number of commonalities. For example, the compound that gives carrots and sweet potatoes their distinctive orange color is beta-carotene. You might well notice its similarity to retinal. The compound that contributes to the red color of tomatoes is lycopene. Molecules of this type are known generically as pigments.
 The wavelengths at which a compound absorbs light depends on the energy gap between the orbitals that are involved in the transition. This energy gap is determined by the structure of the molecule. A molecule with only single bonds absorbs light at shorter wavelengths (in the high-energy UV), while more complex bonding patterns are associated with the absorption of visible light. For example, the presence of multiple pi bonds and their interactions within the molecule can affect the energy gap between the molecular orbitals. Recall our discussion of graphite. Rather than thinking of graphite as sheets of fused six-membered rings with alternating single and double bonds, we can think of each bond as a localized sigma bond and a delocalized pi bond. There are huge numbers of pi molecular orbitals spread over the whole sheet of carbon atoms. The more pi MO’s there are, the more the energy gap between these orbital decreases; that is, the less energy (longer wavelength light) is needed to move an electron from a pi to pi* orbital . In the case of network substances like graphite and metals, the energy gap between the orbitals becomes negligible, and we think of the bonding model as a band of molecular orbitals. In these cases, many wavelengths of light can be absorbed and then re-emitted which gives graphite and metals their characteristic shininess. In substances like lycopene or β-carotene we also find this pattern of alternating single and double bonds. We say that compounds with this pattern of alternating single and double bonds (e.g. –C=C–C=C–) are conjugated, and we can model the bonding in the same way as graphite. There are pi MO’s that can extend over the region of the molecule, and the more orbitals there are, the closer together in energy they get.
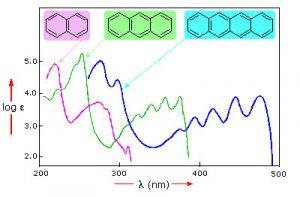 For an isolated C=C double bond, the energy required to promote an electron from the pi to the pi* orbital corresponds to the light in the UV region (around 170 nm), but as the number of double-bonds that are conjugated (separated by single bonds) increases, the energy gap between the highest occupied molecular orbital (HOMO) and the lowest unoccupied molecular orbital (LUMO) decreases. Eventually, the wavelength of light needed to promote an electron from the HOMO to the LUMO moves into the visible region, and the substance becomes colored. (Note that it does not become the color of the light that is absorbed, but rather the remaining light that is transmitted or reflected). These conjugated regions of molecules are called chromophores.[5] The longer the conjugated section of the molecule, the longer the wavelength of light that it absorbs. You will notice that both lycopene and B-carotene contain large chromophore regions.
Samples of UV-VIS absorption spectra are shown here. Note that in contrast to the atomic absorption spectra we saw earlier (which consisted of sharp lines corresponding to the wavelength of light absorbed by atoms) these spectra are broad and ill-defined. In addition, you can see that the longer (larger) the chromophore, the longer the wavelength that is absorbed—and each of these compounds appears to be a different color. The fact that the peaks in these spectra are not sharp means that UV-VIS spectroscopy is typically not used for identification of compounds (see below for IR and NMR spectroscopy which can be used for this purpose). However, the amount of light absorbed is proportional to the concentration of the substance and therefore UV-VIS spectroscopy can be used to determine the concentration of samples.
Questions to Answer:
- Construct a representation that can help you explain why compounds with longer chromophores absorb lower energy photons than those with shorter chromophores
- Which compound do you think absorbs photons of the lowest energy light? Explain your reasoning, using a molecular orbital diagram to illustrate.
Infrared (IR) spectroscopy—looking at molecular vibrations
Up to now we have concentrated on the absorption (and emission) of energy associated with transitions of electrons between quantized energy levels. However, as we discussed earlier, electron energies are not the only quantized energies at the atomic/molecular level. In molecules, both vibrations and rotations are quantized, but the energies involved are much lower than those needed to break bonds. Let us begin with the simplest of molecular systems, consisting of two atoms bonded together. In such a system, the atoms can move back and forth relative to each other along the bond axis (vibrations). As they vibrate and change rotational speeds (and directions), the potential energy of the system changes (Why is that? What factors influence these changes?). There are also motions associated with rotations around bonds. But (weirdly, and quantum-mechanically) rather than being able to assume any value, the energies of these vibrations (and rotations) are also quantized. The energy gaps between the vibrational energy states tend to be in the range of infrared radiation. If three or more atoms are bonded together the molecule can also bend, changing the bond angle or the shape of the molecule.[6]
Infrared radiation is of lower energy than visible light (longer wavelength, lower frequency). You are probably familiar with IR heat lamps that are used for warming and night vision goggles that allow the wearer to “see” at night.[7] Recall that objects tend to emit radiation (the phenomenon is called black-body radiation) as the kinetic energy of the atoms and molecules in the object is converted to electromagnetic radiation. Around 300K (room temperature or body temperature) the radiation emitted is in the IR region of the spectrum.[8] Conversely, when IR radiation falls on our skin, we feel that as a warming sensation, mainly because it is causing the molecules in our skin to vibrate and rotate—increasing the kinetic energy and thus the temperature.
When we investigate the light absorbed or emitted as molecules undergo vibrational energy changes it is known as infrared spectroscopy.[9] Why, you might ask, are we interested in the vibrations of molecules? The vibrations, rotations, and bending movements of molecules are influenced by the structure of the molecule as a whole (as well as its environment). The result is that that many molecules and fragments of molecules have very distinctive IR absorption patterns that can be used to identify them. Infrared spectroscopy allows us to identify substances based on patterns in the lab and, for example, in interstellar dust clouds. The presence of quite complex molecules in space (hundreds of millions of light years away from earth) has been detected by the use of IR spectroscopy.
The types of changes that can be detected using IR spectroscopy are associated both with stretching (vibrations of) one particular bond, and with movements associated with three or more atoms such as bending or twisting. Consider methane for example: Each C–H bond can vibrate separately, but we can also imagine that they could vibrate “in phase” (at the same time) so that the C–H bonds lengthen and shorten at the same time. This movement is called the symmetric stretch. Conversely, we can imagine that one might lengthen as the other shortens: this is called the asymmetric stretch. Furthermore, the molecule can bend and twist in a number of ways so that there are quite a number of possible “vibrational modes.”[10]
Vibrational Modes of CH2
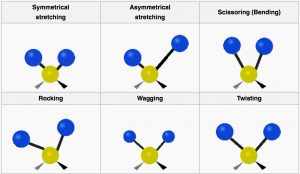 Here we see the the vibrational modes for part of an organic molecule with a CH2 group. Not all these modes can be observed through infrared absorption and emission: vibrations that do not change the dipole movement (or charge distribution) for the molecules (for example, the symmetrical stretch) do not result in absorption of IR radiation, but since there are plenty of other vibrational modes[11] we can always detect the presence of symmetrical molecules like methane (and most other molecules) by IR spectroscopy. In addition, the more the charge distribution changes as the bond stretches, the greater the intensity of the peak. Therefore, as we will see, polar molecules tend to have stronger absorptions than non-polar molecules.
For historical reasons, IR spectra are typically plotted as transmittance (that is the amount of light that is allowed through the sample) versus wavenumber (cm–1).[12] That is, the peaks are inverted, so that at the top of the spectrum 100% of the light is transmitted and at the bottom it is all absorbed.
The position of the absorption in an IR spectrum depends three main factors:
- Bond strength: it makes sense that the energy needed to stretch a bond (i.e. make it vibrate) depends on the strength of the bond. Therefore, multiple bonds appear at higher frequency (wavenumber) than single bonds.
- Whether the vibrations involved involve bond stretching or bending: it is easier to bend a molecule than to stretch a bond.
- The masses of the atoms in a particular bond or group of atoms: bonds to very light atoms (particularly appear at higher frequency).[13]
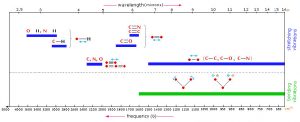
The figure below shows each of the general areas of the IR spectrum and the types of bonds that give rise to absorptions in each area of the spectrum. In general C–H, O–H, and N–H bond stretches appear above 3000 cm–1. Between 2500 and 2000 is typically where triple-bond stretches appear. Between 2000 and 1500 cm–1 is the region where double-bond stretches appear, and the region below 1600 is called the fingerprint region. Typically, there are many peaks in this fingerprint region which may correspond to C–C, C–O and C–N stretches and many of the bending modes. In fact, this region is usually so complex that it is not possible to assign all the peaks, but rather the pattern of peaks may be compared to a database of compounds for identification purposes.
Vibrational Frequencies for Common Bond Types or Functional Groups
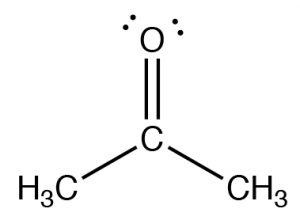 The figure below (↓) shows a spectrum of acetone (→) in which you can see a number of absorptions, the strongest of which appears around 1710 cm–1. Note also that there is a discontinuity in scale above and below 2000 cm–1.
 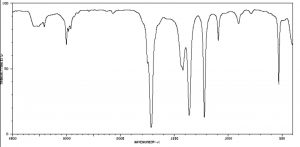 The strong peak around 1710 cm–1 can be ascribed to one particular part of the acetone molecule: the C=O (or carbonyl) group. It turns out that carbonyl groups can be identified by the presence of a strong peak in this region although the wavenumber of absorption may change a little depending on the chemical environment of the carbonyl. The presence of a strong peak between around 1700 cm–1 almost always signifies the presence of a C=O group within the molecule, while its shift from 1700 cm–1 is influenced by the structure of the rest of the molecule.
Functional groups:
The idea that a carbonyl group can be recognized, regardless of the structure of the rest of the molecule, is evidence for a major organizing idea of organic chemistry—that of functional groups.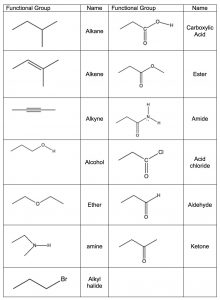 Functional groups are recognizable clusters of atoms within a larger molecule that have predictable properties allowing us to organize and make sense of organic chemistry. Rather than having to look at very large molecules as whole entities, (for example biomolecules that have many thousands to millions of carbon atoms) we can identify functional groups, and if we know how they behave we can predict how the molecule will behave.[14] A list of common functional groups is shown in the table (→) and it is important that over time you learn to recognize each of them. Later, we will consider each of these groups in more detail and discuss their chemistry. For the moment, it is enough to be able to recognize these groups and understand how to use the evidence for the existence of functional groups that can be obtained from IR spectroscopy. Molecules with functional groups always give rise to particular patterns of peaks that correspond to the vibrations associated with that group.
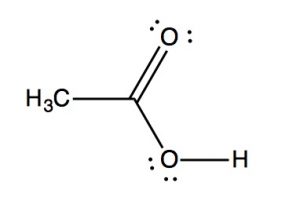 IR spectra can provide evidence for the presence of many of these functional groups, although in practice the most easily detected groups are double bonds—especially the carbonyl (1600–1800 cm–1), and OH and N–H groups (above 3000 cm–1). For example, the spectrum of acetic acid (below) shows two very strong absorptions (above the fingerprint region): a very broad absorption around 3000 cm–1, and a stronger, narrower one around 1720 cm–1.
IR spectrum of Acetic Acid
The broad peak corresponds to the O–H group in the carboxylic acid. It is so broad because this group participates in hydrogen bonding of various types and strengths, meaning that the energy required to promote this bond stretch varies with the degree of hydrogen bonding. The peak at 1720 corresponds to the carbonyl group. It should be noted that there are also C—H stretches around 3000 that are hidden by the strong OH stretches. The take-home message here is that IR spectroscopy is good for identifying clusters of atoms (functional groups) within a larger molecule, but it does not provide us with information about how the atoms in the molecule are actually arranged and connected. For that we need to turn to another kind of spectroscopy: nuclear magnetic resonance.
Questions to Answer
- What factors predict the strength of the IR absorption?
- What factors predict the position of the IR absorption?
- Draw a structure for a carboxylic acid in solution in methanol and use it to explain why the O–H bond absorption is so broad.
Nuclear Magnetic Resonance (NMR) Spectroscopy is a form of spectroscopy based on the fact that atomic nuclei behave like tiny spinning charges that generate a magnetic field. Just as with electrons, nuclei have a characteristic that we call “spin” that is quantized.[15] Nuclei can have spins that are integers (1, 2, 3…) or non-integral spins (1/2, 3/2, 5/2…), and some have no spin. Those nuclei with a non-integral-spin quantum number are said to be NMR active, and of these the two most relevant to NMR analyses of organic molecules are H-1 and C-13, which have spin quantum numbers of ½. When materials that contain carbon or hydrogen are placed in a magnetic field their nuclei can assume either of two possible orientations with respect to the field: a low energy orientation in which the spin- associated nuclear magnet is aligned parallel to the field and a high energy orientation in which the nuclear magnet is aligned anti-parallel to (against) the field. 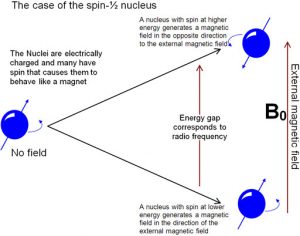 A parallel nucleus can be flipped to the anti-parallel orientation by absorbing the appropriate amount of electromagnetic energy—which happens to be in the radio-wave range. From the pattern of energy absorbed, we can deduce the structure of the molecule being analyzed (see below)
The energies of electromagnetic radiation that cause the nuclei to spin flip are referred to as resonance frequencies, (which is why the method is called nuclear magnetic resonance (NMR) spectroscopy). The same phenomena is involved in magnetic resonance imaging (MRI)—although the “nuclear” part of the name was removed because of concerns that patients might be worried (needlessly) about exposure to damaging radiation. Both NMR and MRI involve placing the specimen, either a chemical sample or a human body, into a very strong magnetic field, but the energy used to “flip” the spin of the nuclei within the sample is relatively low, that is in the radiofrequency range. We are constantly bombarded by low energy radio-waves but their energy is not enough to be absorbed by most molecules, and so they have little effect.[16] It is only when very high magnetic fields are applied to a sample (or body) that the spin states of the nuclei are split (into orientations that are parallel and anti-parallel to the field) and we observe the absorption (or emission) of these low energy radio-waves.
An NMR spectrum (or an MRI image for that matter) requires a sample to be placed into a strong magnetic field. In older NMR spectrometers, the field strength is changed, and the resonance frequencies are recorded. Newer (now almost all) NMR machines operate with a fixed magnetic field strength; the sample is irradiated with radio frequency (RF) radiation at all relevant frequencies which excites all NMR active nuclei into the more energetic spin state. As the nuclei relax, the machine records the energies of the emissions, which are then resolved into distinct wavelength using a Fourier-transform-based deconvolution.
The separation of the spin states (and therefore the amount of energy required to flip them) depends upon the strength of the external magnetic field. For example, for a relatively small magnet of 1.4 Tesla the RF used is 60 MHz; at 7 Tesla the frequency is around 300 MHz.[17] The most modern instruments use very strong magnets, operating in the 1000 MHz range. In practice stronger magnets provide better, more detailed spectra. Since different NMR instruments use different magnetic field strengths, they will also produce different RF absorption/emission peaks for same molecule. In order to make measurements from different NMR instruments comparable, the scale is set to show signals in terms of parts per million (ppm) from a reference signal (see following section on chemical shift.
Carbon-13 NMR Spectroscopy
We begin by considering the use of C-13 NMR spectroscopy because it can provide the simplest type of NMR spectrum. C-13 is a minor isotope of carbon, usually ~1% of carbon nuclei present in sample are C-13 (the majority are C-12 and a very small percentage (less than 1 in a million are C-14). In a C- 13 spectrum, each chemically different carbon atom will give rise to a signal or peak in the spectrum. By chemically different, we mean that the carbons are in different environments; these environments impact the local magnetic field that a particular nucleus will experience. So, for example, while ethane CH3CH3 (obviously) has two carbons, because of the symmetry of molecule, both carbon nuclei experience the same chemical (and local magnetic) environment; we would expect ethane to show a single C-13 NMR peak.
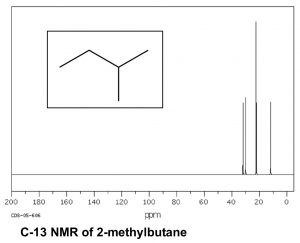
Now consider a more complex hydrocarbon such as 2-methylbutane (ß), which has a total of five carbons; of these the C1 and C2 methyl carbons are in identical chemical environments. The molecule as a whole has four distinct environments and therefore there are 4 peaks in its C-13 NMR spectrum.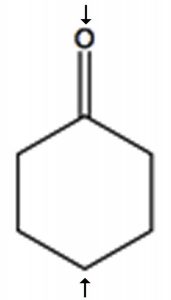
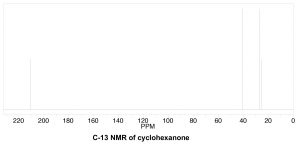
To determine the number of chemically distinct carbons that are present within a molecule, you need to look at the patterns of bonds within the molecule, that is, what each carbon bonded to. One quick way to check for identical chemical environments is to look for planes (or axes) of symmetry in the molecule (ignoring rotations around C–C single bonds). For example, cyclohexanone (→) has a single symmetry axis (marked by arrows); the result is that molecule has only 4 chemically distinct carbons as shown in the spectrum below. Now we need to answer the question of why these signals appear at different places in the spectrum
The chemical shift
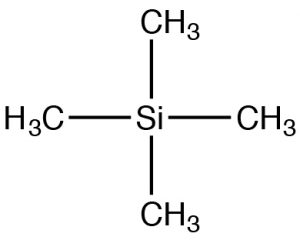 Since NMR instruments may have different field strengths, NMR spectra are often reported with reference to a standard material: tetramethyl silane (TMS). TMS has tetrahedral symmetry, so all of the carbons in the molecule have an identical chemical (local magnetic) environment. We can therefore confidently predict that the C-13 NMR spectra for TMS has a single peak. The chemical shift (in ppm) = shift from TMS/total spectrometer frequency. By using this approach, the chemical shift is not dependent on the type of instrument used. For C-13 NMR the chemical shifts usually range from about 220 to 0. The designation of 0 is where TMS would actually appear, although this signal is often removed from the spectrum for clarity (as in the two preceding spectra). However, if you see spectra with a peak at 0 ppm it is almost certainly due to the TMS standard and should not be used in your determination of the structure.
Shielding and Deshielding
We can answer the question of why NMR signals appear at different places by first remembering that we are dealing not with isolated nuclei, but with molecules that consist of nuclear cores surrounded by electrons that can be described as occupying various molecular orbitals. The electron density around the nucleus has a marked effect on the local magnetic field—that is, the magnetic field that is “felt” by each nucleus. The electrons also “feel” the effect of the magnetic field and begin to circulate around the nuclei to induce a new magnetic field that opposes the original one. This overall impact of this is to reduce the effective nuclear field as shown in the figure below. It now takes a stronger external field to bring the nucleus to resonance at the same frequency (the flip the nuclear spin). 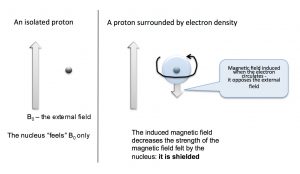
Nuclei that are surrounded by a larger amount of electron density are said to be shielded; they require a larger magnetic field to bring to spin flip than nuclei that are de-shielded (that is, surrounded by lower electron density). Absorption by shielded nuclei tend to be higher (“upfield”) in the spectrum and de-shielded nuclei appear downfield. Consider for example, the C-13 NMR spectrum of 1-chloropropane.
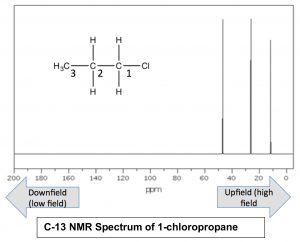
As we might expect, there are 3 peaks in the spectrum, but now we can figure out which is which, because we can predict the relative charge densities on each carbon. The carbon attached to the chlorine (C-1) is most de-shielded by the inductive effect, and therefore should appear at lowest field. Indeed the signal at around 47ppm belongs to the C-1. We can also see how the inductive effect dissipates with distance from the electron withdrawing group to the C-3 signal at around 11 ppm. This is direct evidence for the inductive electron-withdrawing effect.
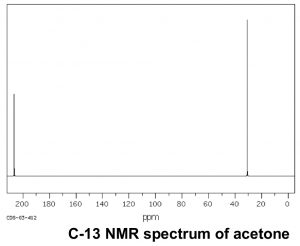
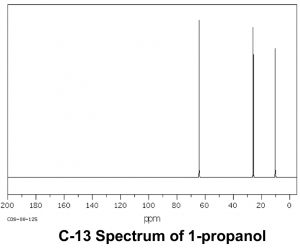
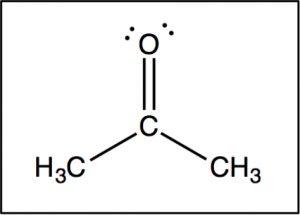 Now let us compare this spectrum to that of acetone. As we might predict, this spectrum has only two peaks in it because acetone only has two types of carbon, but what is even more interesting is that the C=O carbon appears at such low field, around 205 ppm. This means that the C=O carbon must be very electron deficient—much more so than a carbon single-bonded to an oxygen (C–O) in an alcohol, which appears around 64 ppm (as shown in the spectrum of 1-propanol) . This is direct evidence for a phenomenon that we will see time and again, which is that the C=O carbon is highly electron deficient and is very susceptible to nucleophilic attack. Note that the spectrum of acetone also shows this highly downfield shifted peak corresponding to the C=O carbon.
H-1 (proton) NMR:
While C-13 NMR provides information about how many chemically distinct carbons there are in a compound, and something about their electronic environments, it does not tell us anything about how the molecules are organized or which carbons are connected together.[18] For that information, we often turn to NMR spectroscopy using the H-1 isotope. There are a number of advantages to H-1 NMR: H-1 is the naturally-occurring, most-abundant isotope of hydrogen, and is much more abundant than C-13. The result is that the concentration of H-1 in a sample is much greater than the concentration of C-13. It is therefore easier to obtain a spectrum and instruments with a lower field can be used. As we will see, H-1 NMR can provide information about which atoms are connected to each other. On the other hand, the resulting H-1 NMR spectra are more complex.
The basic theory of both H-1 and C-13 NMR are the same and, in fact, both spectra can be recorded on the same instrument. 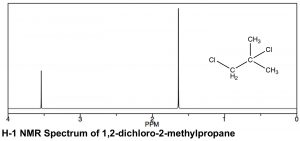 The sample is placed in a magnetic field that splits the spin states of the H-1 nuclei; the energy required to flip the nuclei from one spin state to another is detected and is transformed into a spectrum such as the one below.
There are similarities and differences in the appearance of H-1 and C-13 NMR spectra. As can be seen in the spectrum of 1,2-dichloro-2-methylpropane (←), the scales over which the spectra are recorded are different. Both involve a chemical shift from a reference peak at 0, (TMS [tetramethylsilane] is used in both), but the shift range (often referred to as δ, as well as ppm, in proton NMR) is smaller for H-1 compared to C-13 NMR. Typically an H-1 NMR spectrum is recorded between 0-10 ppm (as opposed to 0-200 for C-13), although in this case it is truncated because there are no peaks between 4–10 ppm. That said, the same trends in chemical shifts are observed: the more de-shielded the atoms (in this case protons) are, the further downfield they appear. In the 1,2-dichloro-2-methylpropane spectrum above there are two peaks corresponding to the two types of chemically distinct hydrogens (that is, the two identical –CH3 and the –CH2 group). The peak’s lowest field, around 3.6 ppm can be assigned to the CH2 (methylene) group, which is directly attached to the electron withdrawing chlorine atom, while the second peak, corresponding to the six equivalent hydrogens of the two methyl groups, is further upfield, around 1.6 ppm.
In a proton NMR spectrum, the area under the peak is proportional to the number of protons that give rise to the signal. By integrating the area under the peak, we generate an estimate of the relative numbers of hydrogens giving rise to each signal. In the spectrum of 1,2-dichloro-2-methylpropane the ratio of the two peak areas is 1:3, thus supporting our assignment of the downfield peak to the CH2 and the upfield peak to the two equivalent –CH3 (six) methyl hydrogens. As a technical note, C-13 NMR signals are not reliably proportional to the number of equivalent carbons involved: they are dependent on the number of H’s attached to them and so integration cannot provide a reliable estimate of the proportions of the types of carbon in a compound.[19]
Spin-Spin Splitting
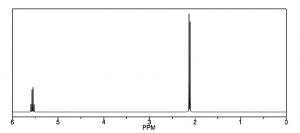 Another way that H-1 NMR differs from a C-13 NMR is shown in the spectrum of 1,1-dichloroethane [latex]\rightarrow[/latex], which has two types of equivalent hydrogens. Each type gives rise to a distinct signal but each of those signals is split into multiple peaks. The upfield signal around 2 ppm, from the 3 equivalent H’s of the methyl group, appears as a doublet (two separate peaks) because each of the hydrogens in the methyl group is affected by the magnetic field generated by the neighboring hydrogen’s possible spin state, thereby altering (adding to or subtracting from) the atoms’ local field. The downfield signal around 5.5 ppm is due to the single proton on C-1, de-shielded because of the proximity of the electronegative chlorine, but now it appears as a quartet.
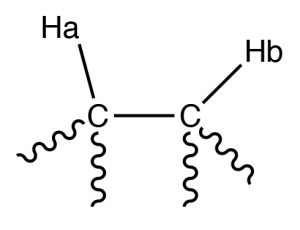 For example, consider a molecule that has two non-equivalent protons (Ha and Hb) on adjacent carbons (→). Ha will experience the magnetic fields generated by Hb which has two spin states, which will produce two possible electronic environments for Ha, resulting in two signals for Ha.
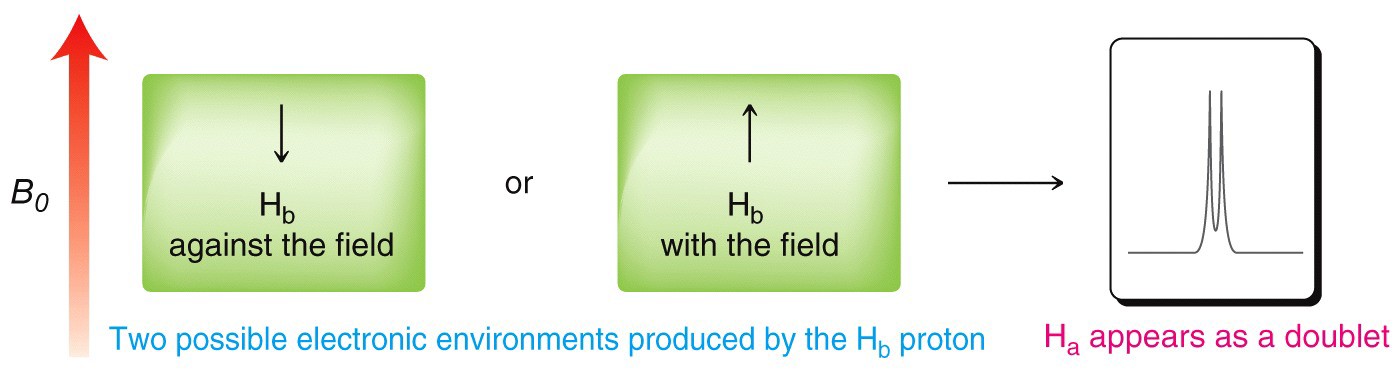
A single proton produces a doublet in the adjacent signal
The splitting effect is small and does not extend (in a significant way) beyond the protons on adjacent carbons. The local magnetic field also depends on the number of protons that do the splitting, for example if there are two protons on the adjacent carbon, the signal is split into a triplet, and for three adjacent protons the signal is a quartet. The general rule is that for n adjacent protons, the signal is split into n+1 peaks.
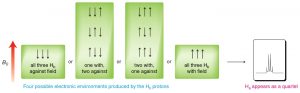
Three adjacent protons produce a quartet in the adjacent signal
The width, in Hz, of the splitting (that is, the distance between the split peaks) is called the coupling constant j. The value of j between the protons on adjacent carbons is the same. The number of split peaks therefore allows us to determine how many hydrogens there are on adjacent carbons, which in turn allows us to determine the how the atoms are connected together in the structure. Signals that are split by more than one kind of hydrogen can get quite messy as shown in the spectrum of D-glucopyranose (→).
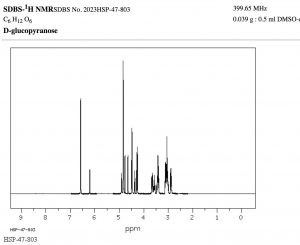 Fortunately, there are ways to simplify such spectrum by selectively irradiating particular frequencies but that is beyond the scope of this course (but something you can look forward to in the future!).
That said, this raises another question: why do C-13 NMR spectra appear as single lines for each carbon? Shouldn’t the carbon signals also be split both by adjacent carbons, and by the hydrogens attached to them? There are two reasons that this does not happen. First, the abundance of C-13 is so low that the probability of finding more than one C-13 in a molecule is very low; in the absence of a second (or third) C-13, no splitting by adjacent carbon nuclei will occur, (recall C-12 does not generate a spin-based magnetic field). Second, when we originally introduced C-13 NMR spectroscopy we presented a simplified model. In fact, the carbon signals are split by the adjacent protons, but this leads to a complex spectrum that is often hard to interpret. Therefore, for most purposes, the sample is irradiated with a radiofrequency that promotes all the hydrogens to the higher-energy spin state. The carbon nuclei do not experience two (or more) magnetic field environments, and therefore only one signal is produced. This technique is called broadband decoupling, and these types of spectra are the most common examples of C-13 NMR.
Solvents and Acidic hydrogens in the NMR
Most NMR spectra, whether C-13 or H-1, are recorded in solution (although it is possible to obtain spectra on solids—as evidenced by the fact that we can obtain MRI data on people, that say, people [biological systems] are mostly [> 70%] water). However, since the solvent is usually present in much greater concentration than the actual sample, as long as we use a solvent that does not generate a strong signal the effects of the solvent can be minimized; typically this involves solvents in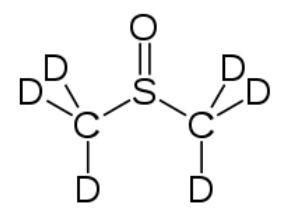 which the hydrogens present are replaced with deuterium (D), an isotope of hydrogen that is not NMR active. Common solvents are CDCl3, (deuterated chloroform) and dimethylsulfoxide d-6 (DMSO) (→).
Another instance in which deuterated solvents are used is to detect the presence of potentially acidic hydrogens. Proton transfer is a rapid and reversible process, and any hydrogen attached to an electronegative element is potentially available for exchange by reacting with even very weak base such as water.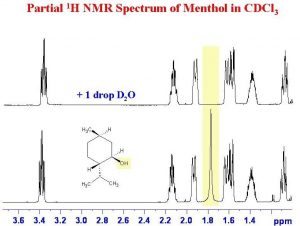 In fact, by adding a drop of D2O (“heavy” water) to the NMR sample, the signal from any O–H or N–H disappears as the H is replaced by D.
As shown here (→), the signal from the OH (shaded in yellow) disappears when the sample is shaken with D2O.
Questions to Answer:
Type your exercises here.
- Draw a diagram of an atom and use it to explain why the electron density surrounding the nucleus affects the strength of the external field required to bring the nucleus to resonance (to flip the spin state).
- Using the table below, use your diagram from above and explain a) why the signals for C-1 in the three compounds are different, and b) why the signals for C-1 and C-2 are different (for any single compound).
|
Compound |
Signal for C-1 |
Signal for C-1 (ppm) |
|
CH3CH2F |
79.1 |
15.4 |
|
CH3CH2Cl |
40.0 |
18.9 |
|
CH3CH2Br |
27.5 |
19.3 |
- Species with unpaired electrons are called radicals or free radicals—they are typically highly reactive and are thought to be implicated in many processes involving cellular damage and aging. ↵
- Fortunately there exist cellular mechanisms that can detect and repair (most) these kinds of radiation-induced mutations. ↵
- http://nivea.psycho.univ paris5.fr/FeelingSupplements/AncientVisions.htm ↵
- Other related molecules are found throughout the biological world, for more examples see http://www.ncbi.nlm.nih.gov/pubmed/3416013 ↵
- http://phototroph.blogspot.com/2006/11/pigments-and-absorption-spectra.html ↵
- A video of various vibrations is here https://www.youtube.com/watch?v=iy-8rguvGnM ↵
- Snakes can see in the infrared which allows them to hunt mammals. In contrast, an ability to see in the infrared would not generally help a mouse see a snake. Can you explain why? ↵
- As the temperature of the object gets higher the energy of the electromagnetic radiation also increases, until it moves into the visible region. This is why very hot objects glow red and then white as they get even hotter. ↵
- In addition to vibrational transitions, we can also investigate transitions from one rotational energy level to another which are associated with microwave radiation, leading to microwave spectroscopy. ↵
- For animated versions of these modes see https://en.wikipedia.org/wiki/Molecular_vibration ↵
- In fact, for linear molecules the number of vibrational modes is 3N-5, and for non-linear molecules it is 3N-6, where N = the number of atoms in the molecule. Therefore, CH4 has 5 x 3 – 6 = 9 possible vibrational modes, although they are not all IR active. ↵
- Spectra are plotted as the % of light transmitted v wavenumber. The units of wavenumber are 1/cm (cm–1), which, if you think about it, are directly related to the frequency of the light (remember that frequency x wavelength = constant (the speed of light). So units of 1/wavelength are in fact directly related to the frequency. ↵
- The vibrations of a molecule can be modeled by thinking of the bonds as springs, and using Hooke’s Law which states that the vibrational frequency is proportional to the bond strength, and inversely proportional to the masses of the atoms in the bond. Therefore, the smaller the masses, the higher the vibrational frequency ↵
- Although it is true that all functional group behavior is affected by the local chemical environment, it is usually possible to predict how this will affect the properties of the functional group. ↵
- This spin arises from the sum of the spins of their component parts, protons and neutrons, which in turn arise from the sum of their component quarks. ↵
- In contrast, more energetic electromagnetic radiation, such as microwaves, are absorbed by water; when absorbed they are converted into kinetic energy, and heat the sample—something that would quickly damage (and kill) living tissue. ↵
- The Earth’s magnetic field ranges from 25–60 x 10–6 Tesla ↵
- Although some types of C-13 NMR spectroscopy can tell us about connectivity it is too complex to discuss here. ↵
- Some of the C-13 nuclei take much longer to relax back to the lower spin state than others (and the energy that is emitted is what is recorded), so it is not really feasible to integrate the peaks. ↵
