
Thermodynamics
109 The First Law of Thermodynamics and Some Simple Processes
Learning Objectives
- Describe how a simple heat engine operates using the first law of thermodynamics.
- Differentiate among the key thermodynamic processes: isobaric, isochoric, isothermal, and adiabatic.
- Compute the total work done during a cyclical thermodynamic process using a PV diagram.
One of the most transformative applications of heat is its use to do mechanical work, accomplished through devices known as heat engines. These include car engines, power plant turbines, and even the human body during metabolism. The operation of a heat engine is governed by the first law of thermodynamics and is represented schematically in Figure 109.2.
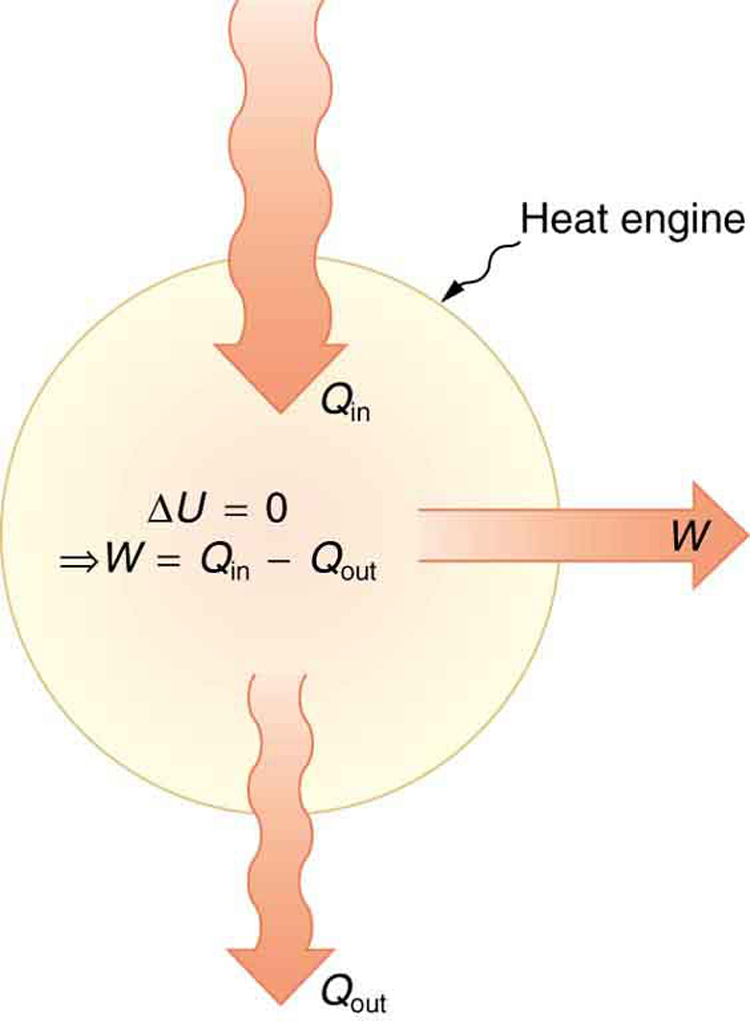

In this thermodynamic cycle, heat energy causes gas particles to exert greater pressure. This pressure moves a piston, doing mechanical work. To reset the system, heat is released, lowering the pressure so the piston returns. This forms the basic operation of a heat engine.
PV Diagrams and Work
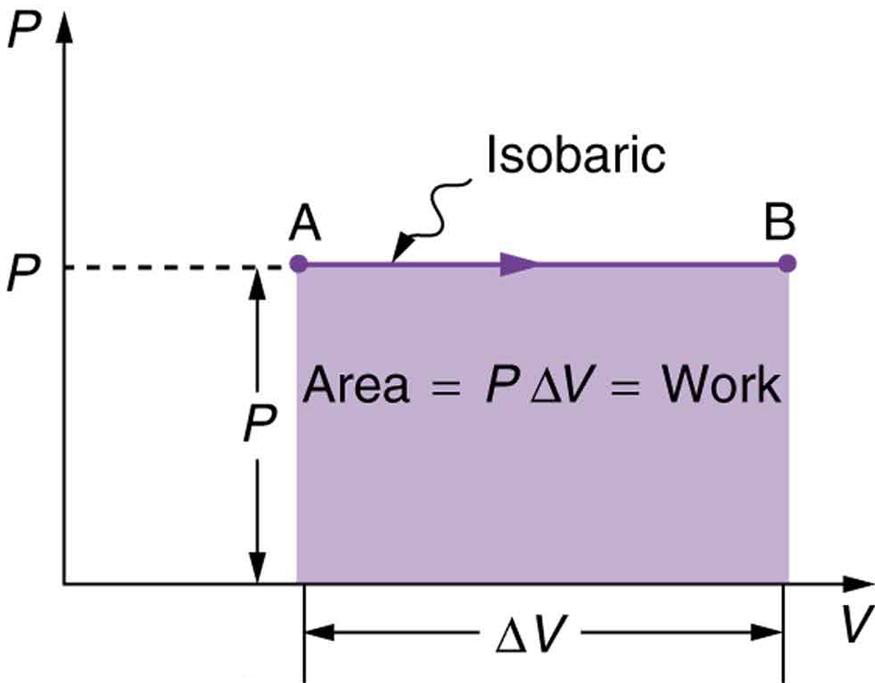
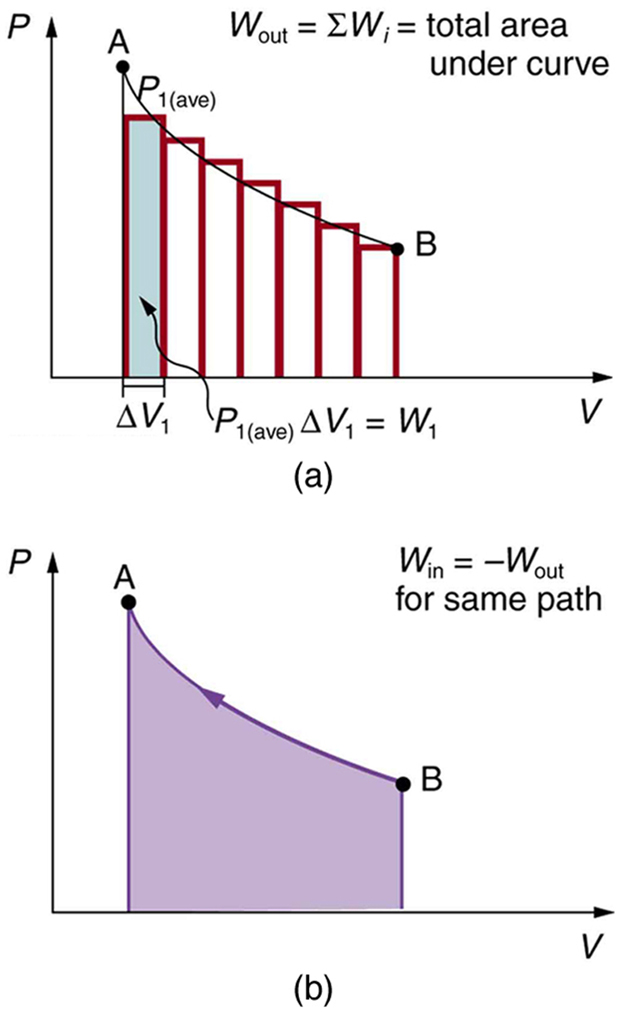
When a gas does work while expanding at constant pressure, the process is called an isobaric process. The work done is the product of pressure and change in volume:
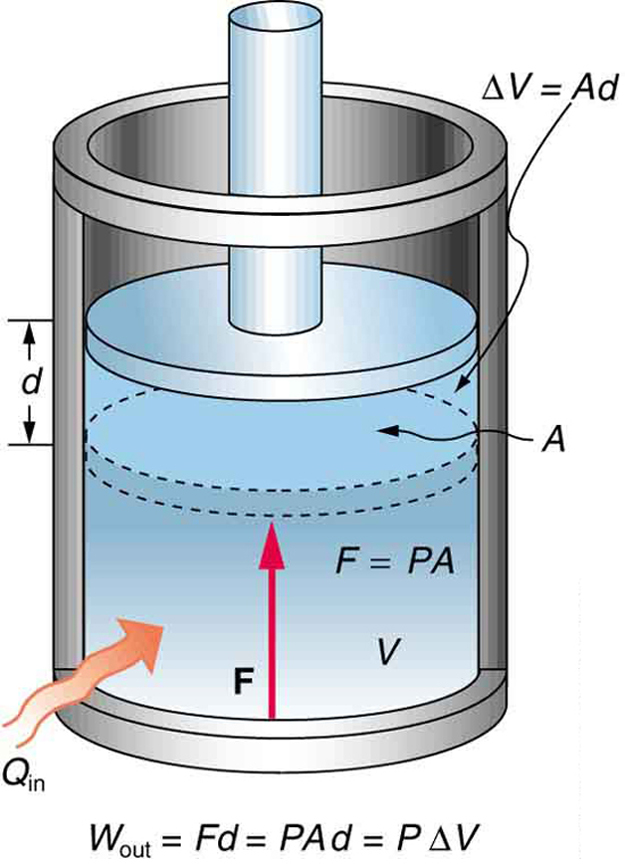
Since pressure is force per unit area, and volume change is area times distance, we get:
In this form, a positive [latex]\Delta V[/latex] indicates work done by the system on the environment. On a PV diagram, this corresponds to the area under the curve.
General PV Processes
When both pressure and volume vary, the work is still the area under the curve on a [latex]PV[/latex] diagram. The process may be divided into small intervals:
Cyclic Processes and Net Work
If a gas goes through a cycle and returns to its starting point, the total work done is the area enclosed by the path on a [latex]PV[/latex] diagram. Clockwise loops imply positive work output.
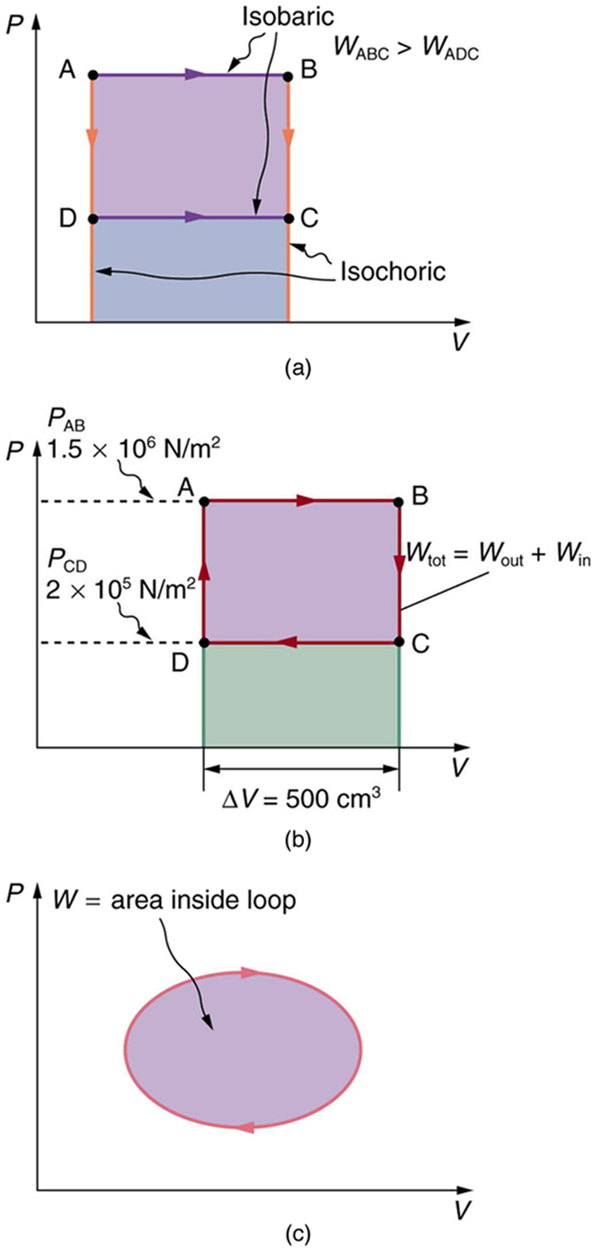
Example 109.1 Total Work Done in a Cyclical Process Equals the Area Inside the Closed Loop on a PV Diagram
Calculate the total work done in the cyclical process ABCDA shown in Figure 109.7 by the following two methods to verify that work equals the area inside the closed loop on the [latex]\text{PV}[/latex] diagram. (Take the data in the figure to be precise to three significant figures.) (a) Calculate the work done along each segment of the path and add these values to get the total work. (b) Calculate the area inside the rectangle ABCDA.
Strategy
To find the work along any path on a [latex]\text{PV}[/latex] diagram, you use the fact that work is pressure times change in volume, or [latex]W=P\Delta V[/latex]. So in part (a), this value is calculated for each leg of the path around the closed loop.
Solution for (a)
The work along path AB is
Since the path BC is isochoric, [latex]\Delta {V}_{\text{BC}}=0[/latex], and so [latex]{W}_{\text{BC}}=0[/latex]. The work along path CD is negative, since [latex]\Delta {V}_{\text{CD}}[/latex] is negative (the volume decreases). The work is
Again, since the path DA is isochoric, [latex]\Delta {V}_{\text{DA}}=0[/latex], and so [latex]{W}_{\text{DA}}=0[/latex]. Now the total work is
Solution for (b)
The area inside the rectangle is its height times its width, or
Thus,
Discussion
The result, as anticipated, is that the area inside the closed loop equals the work done. The area is often easier to calculate than is the work done along each path. It is also convenient to visualize the area inside different curves on [latex]\text{PV}[/latex] diagrams in order to see which processes might produce the most work. Recall that work can be done to the system, or by the system, depending on the sign of [latex]W[/latex]. A positive [latex]W[/latex] is work that is done by the system on the outside environment; a negative [latex]W[/latex] represents work done by the environment on the system.
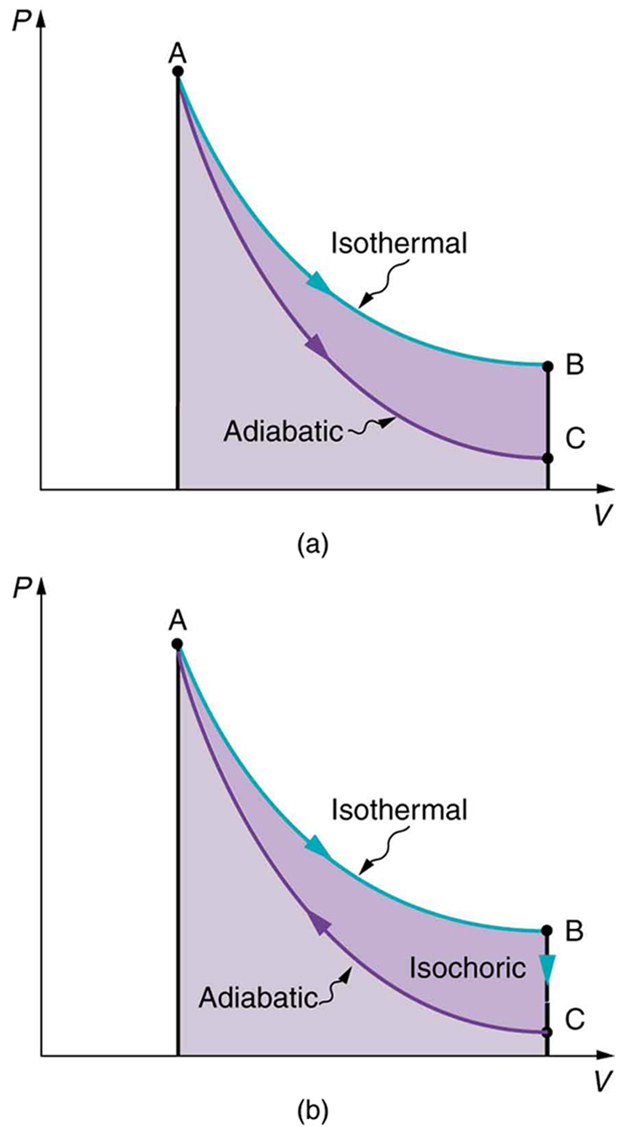
Figure 109.8(a) shows two other important processes on a [latex]\text{PV}[/latex] diagram. For comparison, both are shown starting from the same point A. The upper curve ending at point B is an isothermal process—that is, one in which temperature is kept constant. If the gas behaves like an ideal gas, as is often the case, and if no phase change occurs, then [latex]\text{PV}=\text{nRT}[/latex]. Since [latex]T[/latex] is constant, [latex]\text{PV}[/latex] is a constant for an isothermal process. We ordinarily expect the temperature of a gas to decrease as it expands, and so we correctly suspect that heat transfer must occur from the surroundings to the gas to keep the temperature constant during an isothermal expansion. To show this more rigorously for the special case of a monatomic ideal gas, we note that the average kinetic energy of an atom in such a gas is given by
The kinetic energy of the atoms in a monatomic ideal gas is its only form of internal energy, and so its total internal energy [latex]U[/latex] is
where [latex]N[/latex] is the number of atoms in the gas. This relationship means that the internal energy of an ideal monatomic gas is constant during an isothermal process—that is, [latex]\Delta U=0[/latex]. If the internal energy does not change, then the net heat transfer into the gas must equal the net work done by the gas. That is, because [latex]\Delta U=Q-W=0[/latex] here, [latex]Q=W[/latex]. We must have just enough heat transfer to replace the work done. An isothermal process is inherently slow, because heat transfer occurs continuously to keep the gas temperature constant at all times and must be allowed to spread through the gas so that there are no hot or cold regions.
Also shown in Figure 109.8(a) is a curve AC for an adiabatic process, defined to be one in which there is no heat transfer—that is, [latex]Q=0[/latex]. Processes that are nearly adiabatic can be achieved either by using very effective insulation or by performing the process so fast that there is little time for heat transfer. Temperature must decrease during an adiabatic process, since work is done at the expense of internal energy:
(You might have noted that a gas released into atmospheric pressure from a pressurized cylinder is substantially colder than the gas in the cylinder.) In fact, because [latex]Q=0, \Delta U=–W[/latex] for an adiabatic process. Lower temperature results in lower pressure along the way, so that curve AC is lower than curve AB, and less work is done. If the path ABCA could be followed by cooling the gas from B to C at constant volume (isochorically), Figure 109.8(b), there would be a net work output.
Reversible Processes
Certain thermodynamic processes, such as isothermal and adiabatic processes (see Figure 109.8), are considered reversible—at least in theory. A reversible process is one in which both the thermodynamic system and its surroundings can be returned precisely to their original states by following the reverse path.
In the example of a gas in a piston-cylinder system (similar to Figure 109.4), the reverse isothermal and adiabatic paths would be labeled BA and CA, respectively, on a PV diagram. For reversibility to hold, every aspect of the system and its environment must be perfectly restored.
However, real-world macroscopic processes are never exactly reversible. Energy dissipation—due to friction, turbulence, or imperfect insulation—leads to heat transfer in both directions, regardless of the direction of motion. For instance, even if the gas returns to its initial thermodynamic state, the environment may not, due to accumulated energy losses. Reversibility would require the direction of heat flow to reverse as well, which is not possible in practice.
This highlights a fundamental limitation in real systems: perfectly reversible processes do not occur in nature. The underlying reason is the presence of dissipative mechanisms and the constraints imposed by the second law of thermodynamics. While the first law of thermodynamics does not prevent reverse heat flow (e.g., from cold to hot), we observe that such spontaneous processes never occur. The bursting of a bubble or mixing of substances are everyday examples of irreversible processes.
These observations lead us to the necessity of a second thermodynamic principle, one that defines the direction of processes and limits the efficiency of heat engines. As we’ll see, even idealized, perfectly efficient heat engines must operate through reversible processes to reach their maximum theoretical efficiency. Yet, even these ideal engines cannot convert all thermal energy into useful work.
Summary of Common Thermodynamic Processes
The table below summarizes the major simple thermodynamic processes used in heat engines, along with their defining characteristics and equations:
PhET Explorations: States of Matter
Use the interactive PhET simulation below to observe how different types of molecules behave in solids, liquids, and gases. You can:
- Add or remove thermal energy to trigger phase changes.
- Adjust the temperature or volume of a container and observe changes in pressure.
- View a real-time pressure–temperature (P–T) diagram and relate macroscopic thermodynamic behavior to microscopic particle motion.
- Explore how intermolecular forces and interaction potentials affect state changes and particle motion.
Section Summary
- A heat engine is a machine that uses heat transfer to perform work, following the first law of thermodynamics.
- Key thermodynamic processes include isobaric (constant pressure), isochoric (constant volume), isothermal (constant temperature), and adiabatic (no heat transfer).
- Each process influences pressure, volume, temperature, and energy transfer differently.
- The sign of the work [latex]W[/latex] depends on the direction: if work is done by the system on the environment, [latex]W[/latex] is positive; if work is done on the system, [latex]W[/latex] is negative.
- Although isothermal and adiabatic processes can be theoretically reversible, real systems always involve some energy dissipation, making perfect reversibility impossible in practice.
Conceptual Questions
- A great deal of effort, time, and money has been spent in the quest for the so-called perpetual-motion machine, which is defined as a hypothetical machine that operates or produces useful work indefinitely and/or a hypothetical machine that produces more work or energy than it consumes. Explain, in terms of heat engines and the first law of thermodynamics, why or why not such a machine is likely to be constructed.
- One method of converting heat transfer into doing work is for heat transfer into a gas to take place, which expands, doing work on a piston, as shown in the figure below. (a) Is the heat transfer converted directly to work in an isobaric process, or does it go through another form first? Explain your answer. (b) What about in an isothermal process? (c) What about in an adiabatic process (where heat transfer occurred prior to the adiabatic process)?
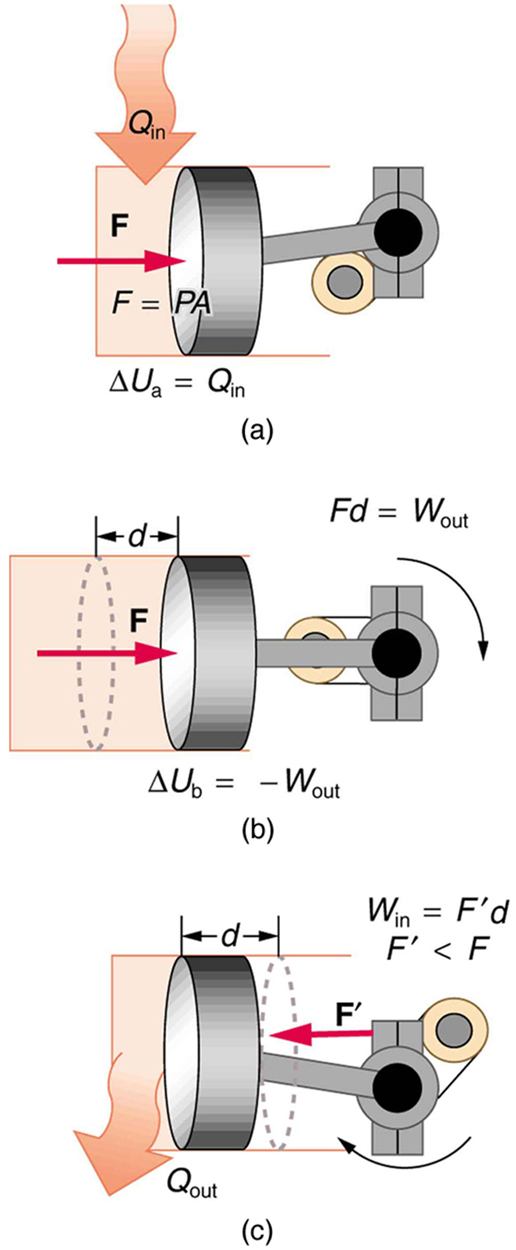
Figure 109.9 - Would the previous question make any sense for an isochoric process? Explain your answer.
- We ordinarily say that [latex]\Delta U=0[/latex] for an isothermal process. Does this assume no phase change takes place? Explain your answer.
- The temperature of a rapidly expanding gas decreases. Explain why in terms of the first law of thermodynamics. (Hint: Consider whether the gas does work and whether heat transfer occurs rapidly into the gas through conduction.)
- Which cyclical process represented by the two closed loops, ABCFA and ABDEA, on the [latex]\text{PV}[/latex] diagram in the figure below produces the greatest net work? Is that process also the one with the smallest work input required to return it to point A? Explain your responses.
- The two cyclical processes shown on this [latex]\mathrm{PV}[/latex] diagram start with and return the system to the conditions at point A, but they follow different paths and produce different amounts of work.
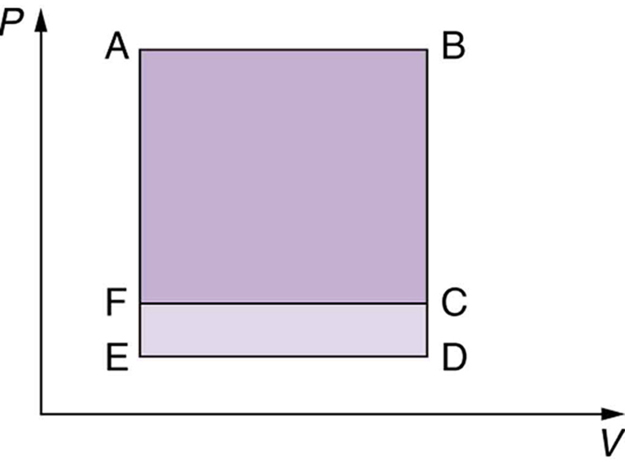
Figure 109.10 - A real process may be nearly adiabatic if it occurs over a very short time. How does the short time span help the process to be adiabatic?
- It is unlikely that a process can be isothermal unless it is a very slow process. Explain why. Is the same true for isobaric and isochoric processes? Explain your answer.
Problem Exercises
- A car tire contains [latex]0\text{.}\text{0380}{m}^{3}[/latex] of air at a pressure of [latex]2\text{.}\text{20}×{\text{10}}^{5}\phantom{\rule{0.25em}{0ex}}{\text{N/m}}^{2}[/latex] (about 32 psi). How much more internal energy does this gas have than the same volume has at zero gauge pressure (which is equivalent to normal atmospheric pressure)?
- A helium-filled toy balloon has a gauge pressure of 0.200 atm and a volume of 10.0 L. How much greater is the internal energy of the helium in the balloon than it would be at zero gauge pressure?
- Steam to drive an old-fashioned steam locomotive is supplied at a constant gauge pressure of [latex]1\text{.}\text{75}×{\text{10}}^{6}\phantom{\rule{0.25em}{0ex}}{\text{N/m}}^{2}[/latex] (about 250 psi) to a piston with a 0.200-m radius. (a) By calculating [latex]P\text{Δ}V[/latex], find the work done by the steam when the piston moves 0.800 m. Note that this is the net work output, since gauge pressure is used. (b) Now find the amount of work by calculating the force exerted times the distance traveled. Is the answer the same as in part (a)?
- A hand-driven tire pump has a piston with a 2.50-cm diameter and a maximum stroke of 30.0 cm. (a) How much work do you do in one stroke if the average gauge pressure is [latex]2\text{.}\text{40}×{\text{10}}^{5}\phantom{\rule{0.25em}{0ex}}{\text{N/m}}^{2}[/latex] (about 35 psi)? (b) What average force do you exert on the piston, neglecting friction and gravitational force?
- Calculate the net work output of a heat engine following path ABCDA in the figure below.
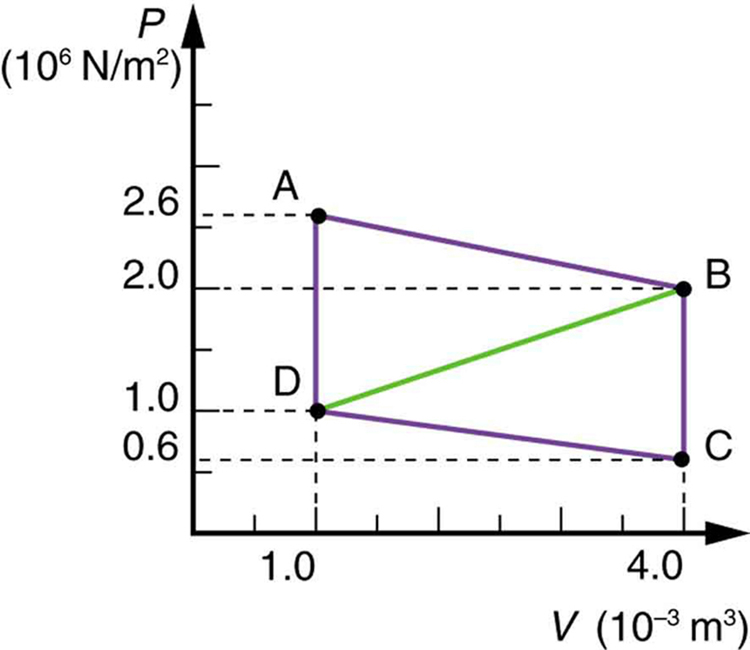 Figure 109.11
 - What is the net work output of a heat engine that follows path ABDA in the figure above, with a straight line from B to D? Why is the work output less than for path ABCDA?
- Unreasonable Results What is wrong with the claim that a cyclical heat engine does 4.00 kJ of work on an input of 24.0 kJ of heat transfer while 16.0 kJ of heat transfers to the environment?
- (a) A cyclical heat engine, operating between temperatures of [latex]\text{450º C}[/latex] and [latex]\text{150º C}[/latex] produces 4.00 MJ of work on a heat transfer of 5.00 MJ into the engine. How much heat transfer occurs to the environment? (b) What is unreasonable about the engine? (c) Which premise is unreasonable?
- Construct Your Own Problem Consider a car’s gasoline engine. Construct a problem in which you calculate the maximum efficiency this engine can have. Among the things to consider are the effective hot and cold reservoir temperatures. Compare your calculated efficiency with the actual efficiency of car engines.
- Construct Your Own Problem Consider a car trip into the mountains. Construct a problem in which you calculate the overall efficiency of the car for the trip as a ratio of kinetic and potential energy gained to fuel consumed. Compare this efficiency to the thermodynamic efficiency quoted for gasoline engines and discuss why the thermodynamic efficiency is so much greater. Among the factors to be considered are the gain in altitude and speed, the mass of the car, the distance traveled, and typical fuel economy.
Glossary
- heat engine
- a machine that uses heat transfer to do work
- isobaric process
- constant-pressure process in which a gas does work
- isochoric process
- a constant-volume process
- isothermal process
- a constant-temperature process
- adiabatic process
- a process in which no heat transfer takes place
- reversible process
- a process in which both the heat engine system and the external environment theoretically can be returned to their original states
constant-pressure process in which a gas does work
a constant-volume process
a constant-temperature process
a process in which no heat transfer takes place
a graph of pressure vs. volume
heat transfer flows from a hotter to a cooler object, never the reverse, and some heat energy in any process is lost to available work in a cyclical process
a machine that uses heat transfer to do work
a process in which both the heat engine system and the external environment theoretically can be returned to their original states
