
Temperature, Kinetic Theory, and the Gas Laws
97 Phase Changes
Learning Objectives
- Interpret a phase diagram.
- State Dalton’s law.
- Identify and describe the triple point of a substance from its phase diagram.
- Describe the state of equilibrium between different phases of matter.
Real Gases and Phase Transitions
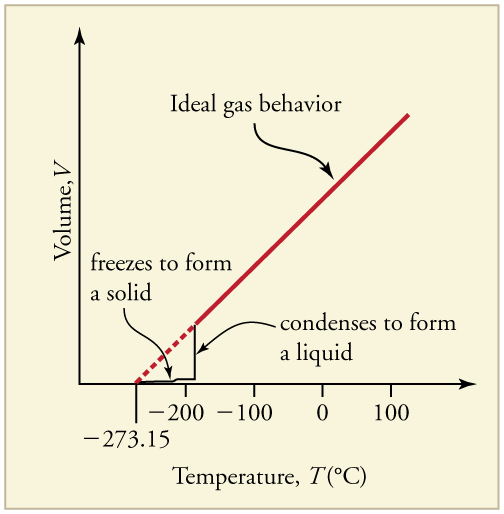
So far, we’ve focused on ideal gas behavior, which works well at high temperatures and low pressures. However, real gases deviate from ideal behavior when molecules are packed closely together—typically at lower temperatures or higher pressures. Under these conditions, attractive intermolecular forces and the finite volume of molecules become important. As shown in Figure 97.1, a gas cools and condenses into a liquid, leading to a sharp drop in volume. Further cooling solidifies the liquid, though the total volume never reaches zero due to the actual size of the molecules.
These transitions are critical in many biological and technological applications. For example, sublimation and liquefaction are used in freeze-drying of foods and cryopreservation of tissues using [latex]{\text{LN}}_2[/latex] (liquid nitrogen).
PV Diagrams
A PV diagram plots pressure versus volume. For an ideal gas, the relationship follows the ideal gas law:
If the number of molecules and the temperature are held constant, this reduces to:
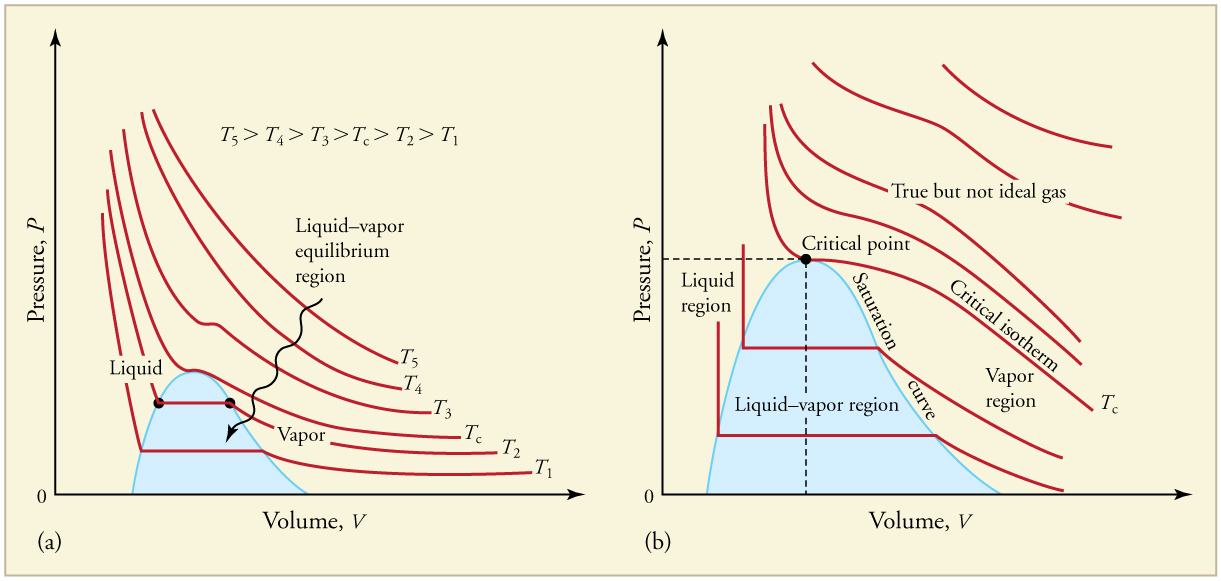
Plotting this equation on a graph produces a hyperbola, known as an isotherm, representing constant temperature. At lower temperatures, deviations from ideal behavior appear, especially when the gas condenses into a liquid. This behavior is depicted in Figure 97.2, where isotherms flatten out during the phase change from gas to liquid.
There is a specific critical temperature above which a gas cannot condense into a liquid, regardless of the pressure applied. Similarly, the critical pressure is the minimum pressure needed to liquefy a gas at that temperature. For instance, carbon dioxide cannot become a liquid above [latex]31.1^\circ \text{C}[/latex]. Critical points are important for understanding and designing pressure-based refrigeration and cryogenic systems. Table 97.1 lists representative critical temperatures and pressures.
Phase Diagrams
A phase diagram shows the phases of a substance as a function of temperature and pressure. These [latex]PT[/latex] graphs help us identify the conditions under which a substance exists as a solid, liquid, or gas. The boundaries between regions show where phases coexist in equilibrium.
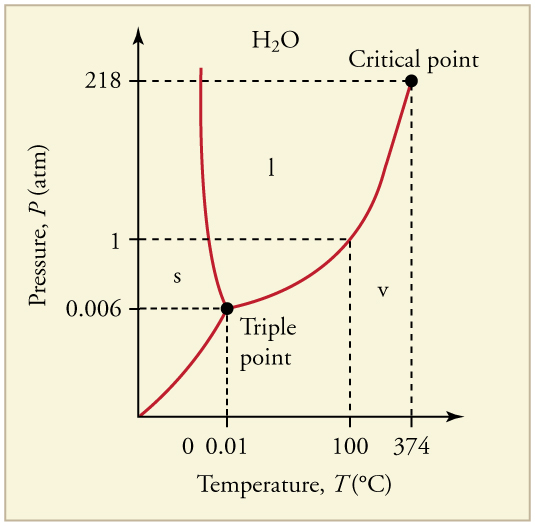
Figure 97.3 illustrates the phase diagram for water. For instance, water boils at [latex]100^\circ \text{C}[/latex] under 1 atm of pressure, but the boiling temperature increases under higher pressures. This principle explains why food cooks faster in a pressure cooker.
At very low pressures, the liquid phase of some substances (like water or carbon dioxide) ceases to exist. The direct transition between solid and gas is called sublimation. This process is used in freeze-drying and occurs naturally with snowpacks.
The unique point where all three phases (solid, liquid, and gas) coexist in equilibrium is called the triple point. For water, this occurs at 273.16 K (0.01°C) and is used to define the Kelvin temperature scale. See Table 97.2 for triple point data of other substances.
Equilibrium Between Phases
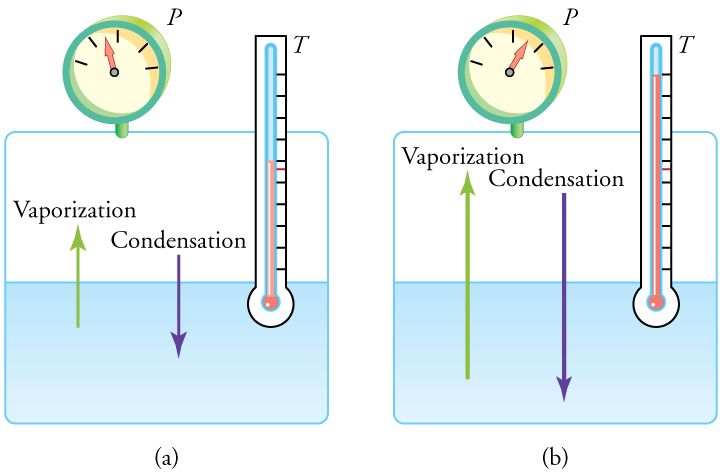
At the boiling point, a liquid and its vapor are in equilibrium—meaning molecules evaporate and condense at the same rate. In a closed container, as shown in Figure 97.4, the liquid does not boil away as long as this balance exists.
If pressure and temperature increase together, the evaporation and condensation rates also increase, maintaining equilibrium. However, in an open container, like a pot of boiling water, steam escapes, preventing equilibrium and allowing the water to boil away.
Below the boiling point, evaporation can still occur if the vapor pressure of the substance is higher than the partial pressure of that vapor in the surrounding air. This explains why water slowly evaporates even at room temperature.
Vapor Pressure, Partial Pressure, and Dalton’s Law
Vapor pressure is the pressure exerted by a gas in equilibrium with its solid or liquid form. It depends on the temperature—higher temperatures increase vapor pressure.
In mixtures of gases, each gas exerts a partial pressure, which is the pressure it would exert if it occupied the entire volume alone. According to Dalton’s law of partial pressures, the total pressure is the sum of the partial pressures:
This law is important in understanding respiration, anesthesia delivery, and hyperbaric treatments. For example, oxygen’s partial pressure in the lungs affects gas exchange with blood.
Check Your Understanding
Q: Why does a drink with ice stay at [latex]0^\circ \text{C}[/latex] on a hot day?
A: As long as ice is present, it is in thermal equilibrium with the liquid water. The temperature remains constant at the freezing point until all the ice has melted. Only then does the water begin to warm up.
Q: Is energy involved in a phase change? Why is water sprayed on orange trees during freezing conditions?
A: Yes, energy is involved in every phase change. Going from solid to liquid or liquid to gas requires energy input to break molecular bonds. Conversely, gas condensing to liquid or liquid freezing to solid releases energy. Spraying water on trees releases latent heat during freezing, which protects the oranges from freezing damage.
PhET Explorations: States of Matter—Basics
Explore how atoms and molecules behave as they transition between the solid, liquid, and gas phases. This interactive simulation allows you to apply heat or cold and observe changes in molecular motion, spacing, and structure. You can also compress the system to see how pressure influences phase transitions. These visualizations help build an intuitive understanding of phase behavior that underlies processes like respiration, freezing of tissues, and fluid dynamics in biological systems.
Section Summary
- Most substances have three distinct phases: gas, liquid, and solid.
- Phase changes among the various phases of matter depend on temperature and pressure.
- The existence of the three phases with respect to pressure and temperature can be described in a phase diagram.
- Two phases coexist (i.e., they are in thermal equilibrium) at a set of pressures and temperatures. These are described as a line on a phase diagram.
- The three phases coexist at a single pressure and temperature. This is known as the triple point and is described by a single point on a phase diagram.
- A gas at a temperature below its boiling point is called a vapor.
- Vapor pressure is the pressure at which a gas coexists with its solid or liquid phase.
- Partial pressure is the pressure a gas would create if it existed alone.
- Dalton’s law states that the total pressure is the sum of the partial pressures of all of the gases present.
Conceptual Questions
- A pressure cooker contains water and steam in equilibrium at a pressure greater than atmospheric pressure. How does this greater pressure increase cooking speed?
- Why does condensation form most rapidly on the coldest object in a room—for example, on a glass of ice water?
- What is the vapor pressure of solid carbon dioxide (dry ice) at [latex]–\text{78}\text{.}5\text{º}\text{C}[/latex]?
- Can carbon dioxide be liquefied at room temperature ([latex]\text{20}\text{º}\text{C}[/latex])? If so, how? If not, why not? (See Figure 97.6)
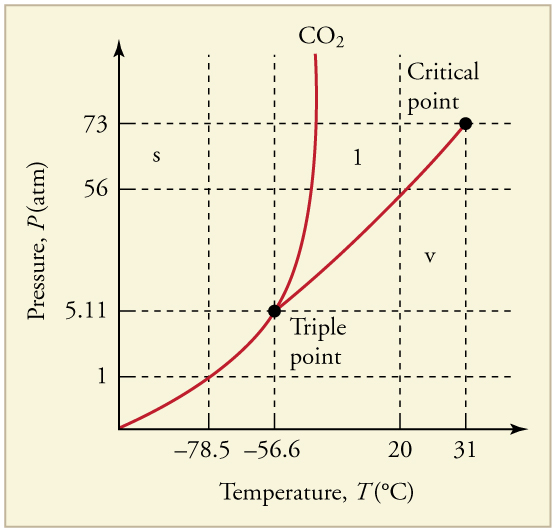
Figure 97.6: The phase diagram for carbon dioxide. The axes are nonlinear, and the graph is not to scale. Dry ice is solid carbon dioxide and has a sublimation temperature of [latex]–\text{78}\text{.}5\text{º}\text{C}[/latex] - Oxygen cannot be liquefied at room temperature by placing it under a large enough pressure to force its molecules together. Explain why this is.
- What is the distinction between gas and vapor?
Glossary
- PV diagram
- a graph of pressure vs. volume
- critical point
- the temperature above which a liquid cannot exist
- critical temperature
- the temperature above which a liquid cannot exist
- critical pressure
- the minimum pressure needed for a liquid to exist at the critical temperature
- vapor
- a gas at a temperature below the boiling temperature
- vapor pressure
- the pressure at which a gas coexists with its solid or liquid phase
- phase diagram
- a graph of pressure vs. temperature of a particular substance, showing at which pressures and temperatures the three phases of the substance occur
- triple point
- the pressure and temperature at which a substance exists in equilibrium as a solid, liquid, and gas
- sublimation
- the phase change from solid to gas
- partial pressure
- the pressure a gas would create if it occupied the total volume of space available
- Dalton’s law of partial pressures
- the physical law that states that the total pressure of a gas is the sum of partial pressures of the component gases
a graph of pressure vs. temperature of a particular substance, showing at which pressures and temperatures the three phases of the substance occur
the physical law that states that the total pressure of a gas is the sum of partial pressures of the component gases
the pressure and temperature at which a substance exists in equilibrium as a solid, liquid, and gas
the condition in which heat no longer flows between two objects that are in contact; the two objects have the same temperature
the phase change from solid to gas
the temperature above which a liquid cannot exist
the minimum pressure needed for a liquid to exist at the critical temperature
the pressure at which a gas coexists with its solid or liquid phase
the pressure a gas would create if it occupied the total volume of space available
a graph of pressure vs. volume
the temperature above which a liquid cannot exist
a gas at a temperature below the boiling temperature
