
Oscillatory Motion and Waves and Physics of Hearing.
133 Hearing
Learning Objectives
- Define hearing, pitch, loudness, timbre, note, tone, phon, ultrasound, and infrasound.
- Compare loudness to frequency and intensity of a sound.
- Identify structures of the inner ear and explain how they relate to sound perception.

The human ear has a remarkable range and sensitivity. It can detect simple characteristics such as pitch, loudness, and direction, and can also perceive musical quality and the nuances of emotion in a voice. But how exactly is hearing connected to the physical characteristics of sound, and how does the auditory system function?
Hearing is the perception of sound. Normal human hearing ranges from 20 Hz to 20,000 Hz. Sounds below 20 Hz are called infrasound, and those above 20,000 Hz are ultrasound. These extreme frequencies are typically not perceived as sound by humans—though infrasound may sometimes be felt as vibration. Other animals hear differently: dogs detect up to 30,000 Hz, and dolphins and bats can hear up to 100,000 Hz. Dogs, for example, respond to dog whistles that are inaudible to humans. Elephants can detect frequencies below 20 Hz.
The perception of frequency is called pitch. Humans can typically distinguish between two tones if their frequencies differ by 0.3% or more—for example, 500 Hz versus 501.5 Hz. Pitch is primarily determined by frequency and is not significantly influenced by intensity. Musical notes are specific frequencies given names in Western music, and some individuals possess perfect pitch, the rare ability to identify notes like A-sharp or C just by hearing them.
The human ear is extremely sensitive to low-intensity sounds. The minimum audible intensity is about
which corresponds to 0 dB. At the upper limit, sounds with intensities of
can be briefly tolerated. The perception of sound intensity is called loudness. At a fixed frequency, changes as small as 1 dB can be detected, and a 3 dB change is clearly noticeable. However, loudness depends on both intensity and frequency. Human ears are most sensitive to frequencies between 2000 and 5000 Hz, and sounds in this range seem louder than those at higher or lower frequencies, even if the actual intensities are equal.
Sound Perceptions and Physical Quantities
Table 133.1 summarizes how certain auditory perceptions relate to measurable physical quantities.
Consider two instruments—say, a violin and a piano—playing the same note (e.g., middle C). They sound very different due to variations in the frequencies and intensities they produce. This property is known as timbre. Timbre is our perception of tone quality and is more difficult to quantify than pitch or loudness. Descriptive words like “warm,” “bright,” or “rich” are often used to characterize timbre. These qualities are shaped by both physical characteristics and psychological interpretation, and fall within the field of perceptual psychology.
Phons and Equal-Loudness Curves
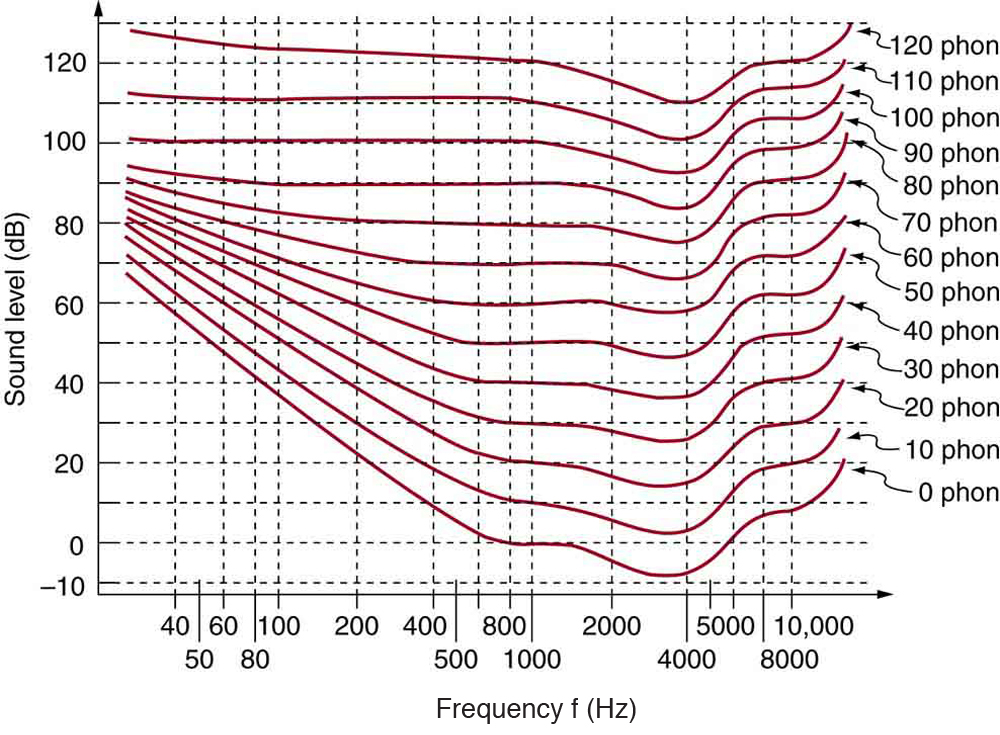
Loudness can also be expressed in phons, which reflect perceived loudness rather than physical intensity. Phons differ from decibels (dB) in that they incorporate human hearing response across frequencies. Figure 133.2 displays equal-loudness curves: each curve shows combinations of frequency and intensity that produce the same perceived loudness. At 1000 Hz, phon values are numerically equal to decibel levels.
Example 133.1: Measuring Loudness: Loudness Versus Intensity Level and Frequency
(a) What is the loudness in phons of a 100-Hz sound that has an intensity level of 80 dB? (b) What is the intensity level in decibels of a 4000-Hz sound having a loudness of 70 phons? (c) At what intensity level will an 8000-Hz sound have the same loudness as a 200-Hz sound at 60 dB?
Strategy for (a)
The graph in Figure 133.2 should be referenced in order to solve this example. To find the loudness of a given sound, you must know its frequency and intensity level and locate that point on the square grid, then interpolate between loudness curves to get the loudness in phons.
Solution for (a)
- Identify knowns:
- • The square grid of the graph relating phons and decibels is a plot of intensity level versus frequency—both physical quantities.
- • 100 Hz at 80 dB lies halfway between the curves marked 70 and 80 phons.
- Find the loudness: 75 phons.
Strategy for (b)
The graph in Figure 133.2 should be referenced in order to solve this example. To find the intensity level of a sound, you must have its frequency and loudness. Once that point is located, the intensity level can be determined from the vertical axis.
Solution for (b)
- Identify knowns:
- • Values are given to be 4000 Hz at 70 phons.
- Follow the 70-phon curve until it reaches 4000 Hz. At that point, it is below the 70 dB line at about 67
- Find the intensity level: 67 dB
Strategy for (c)
The graph in Figure 133.2 should be referenced in order to solve this example.
Solution for (c)
- Locate the point for a 200 Hz and 60 dB sound.
- Find the loudness: This point lies just slightly above the 50-phon curve, and so its loudness is 51 phons.
- Look for the 51-phon level is at 8000 Hz: 63 dB.
Discussion
These answers, like all information extracted from Figure 133.2, have uncertainties of several phons or several decibels, partly due to difficulties in interpolation, but mostly related to uncertainties in the equal-loudness curves.
Further analysis of the graph in Figure 133.2 highlights key features of human auditory perception. First, sounds that fall below the 0-phon curve are generally inaudible to individuals with typical hearing. For instance, a 60 Hz tone at 40 dB would not be heard by most people. The 0-phon curve delineates the threshold of normal hearing. Interestingly, some sounds with negative decibel levels are still audible, provided they lie above the 0-phon curve—such as a 3-dB sound at 5000 Hz.
These loudness curves display a notable dip between approximately 2000 and 5000 Hz, indicating that the human ear is particularly sensitive to frequencies within this range. For example, a 15-dB sound at 4000 Hz is perceived to be just as loud as a 20-dB sound at 1000 Hz. On the other hand, frequencies at both the low and high extremes of the spectrum require higher intensity levels to be perceived as equally loud. A sound at 10,000 Hz, for instance, must reach 30 dB to match the perceived loudness of a 20-dB sound at 1000 Hz. Sounds that exceed 120 phons are not only extremely loud but can also cause pain and physical damage to the auditory system.
Despite the wide range of frequencies that the human ear can detect, we do not typically use the full extent of our hearing capabilities. This is particularly true for sounds above 8000 Hz, which are uncommon in natural environments and unnecessary for everyday speech or musical perception. Consequently, individuals who experience high-frequency hearing loss are often unaware of the deficit until formal testing is conducted.
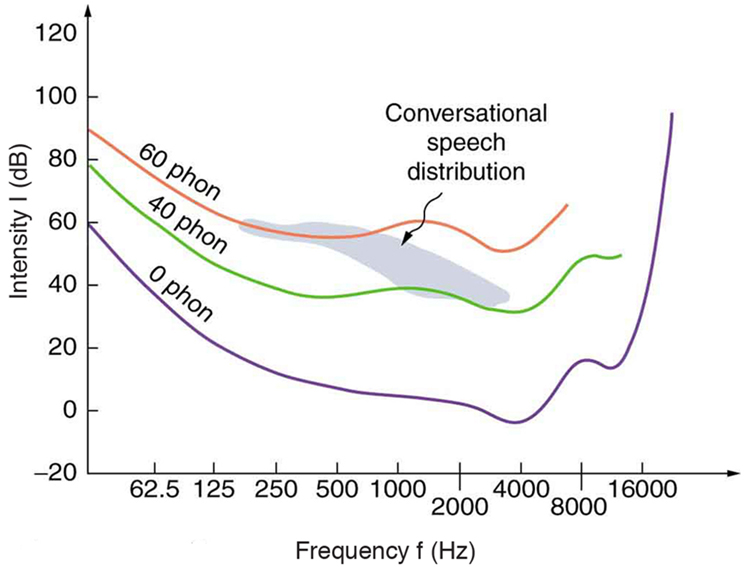
The shaded area in Figure 133.3 represents the frequency and intensity range of typical conversational speech. The figure also includes curves for individuals with hearing losses of 40 and 60 phons. A person with a 40-phon hearing loss may still understand speech, but it will sound significantly quieter. In contrast, a 60-phon loss restricts perception primarily to low frequencies, making normal conversation difficult to comprehend without significant amplification. Even then, speech may remain unclear due to reduced sensitivity to higher frequencies.
Additionally, gender differences in voice frequency can influence auditory comprehension in those with hearing loss. Female voices tend to have higher frequencies, which may be particularly challenging to detect for individuals with high-frequency hearing impairments.
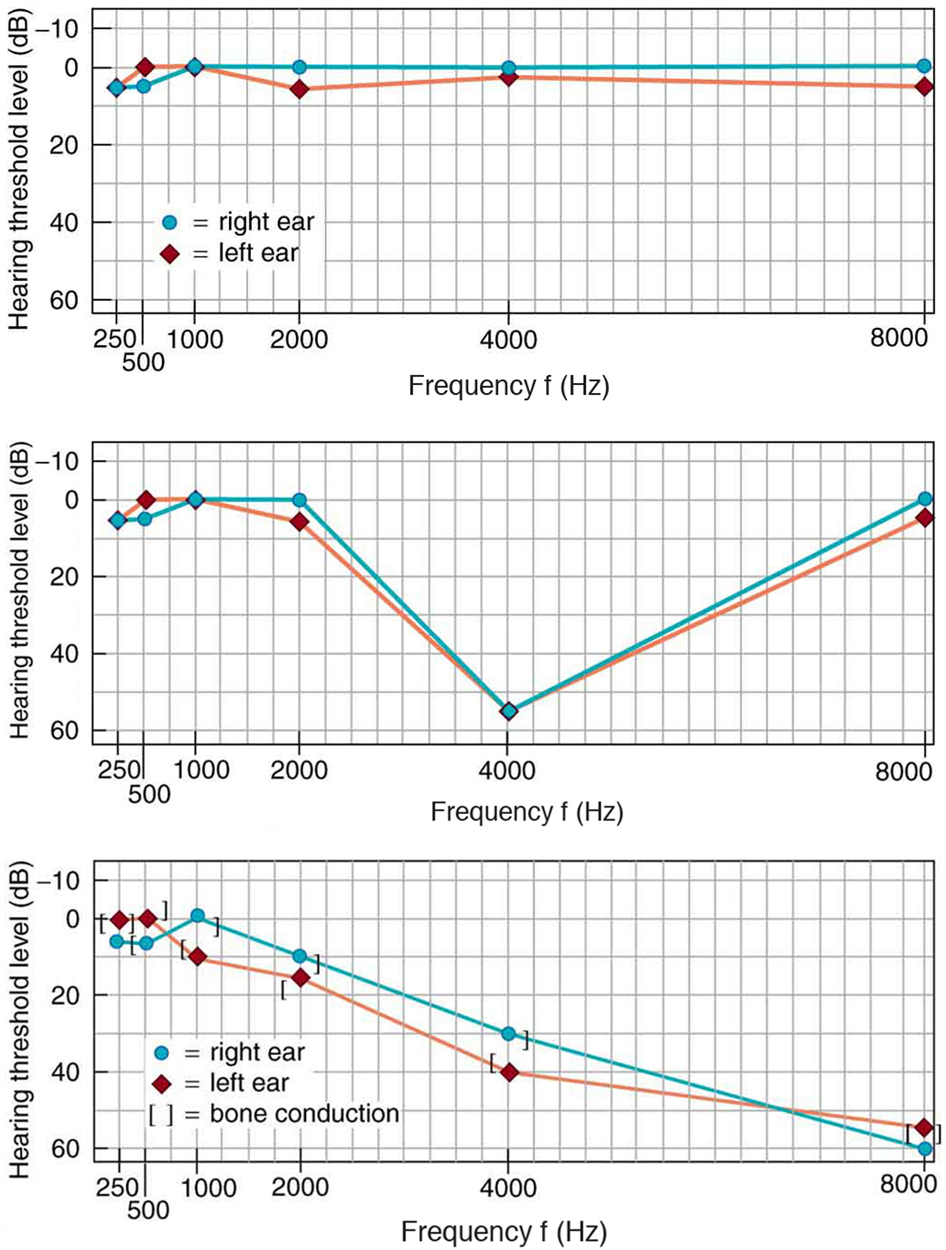
Hearing tests typically assess responses to sound frequencies between 250 and 8000 Hz. Results from these tests are often displayed in an audiogram, as shown in Figure 133.4. In an audiogram, the hearing threshold is measured in decibels relative to a standard reference threshold—meaning that 0 dB corresponds to normal hearing at each frequency. One common pattern of hearing loss, often caused by noise exposure, is characterized by a distinct dip near 4000 Hz. This pattern appears regardless of the frequency of the sound that caused the damage and usually affects both ears.
The most prevalent type of hearing loss, known as presbycusis, is age-related. It involves progressive loss of sensitivity to higher frequencies and can interfere with both music appreciation and the ability to distinguish speech sounds.
The Hearing Mechanism
The human ear is an advanced biological system that transduces sound waves—specifically, pressure variations in air—into electrical signals that the brain can interpret. This process involves both mechanical and neural components and is significantly more complex than the functioning of a typical microphone. Figure 133.5 shows the gross anatomy of the ear, which is traditionally divided into three main regions: the outer ear (or auditory canal), the middle ear (containing ossicles), and the inner ear (primarily the cochlea).
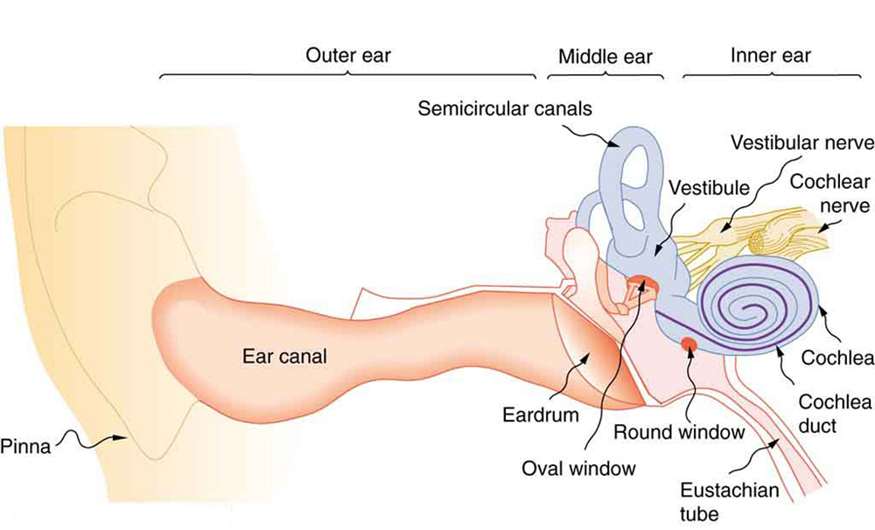
The outer ear functions to funnel sound waves into the auditory canal, directing them toward the eardrum (tympanic membrane). The canal itself is resonant, enhancing sensitivity to sounds in the 2000–5000 Hz range, where human hearing is most acute.
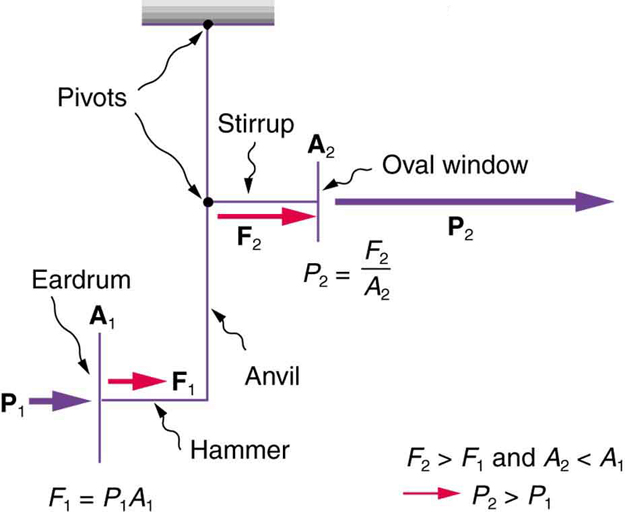
The middle ear contains a set of three tiny bones—the malleus (hammer), incus (anvil), and stapes (stirrup)—that form a lever system. These ossicles amplify the pressure exerted by incoming sound waves and transmit that amplified force to the cochlea via the oval window. This amplification increases the pressure by a factor of about 40, relative to the pressure on the eardrum. Two small muscles within the middle ear (not shown in Figure 133.6) can contract reflexively in response to loud sounds. This contraction reduces the efficiency of the ossicular lever system, providing a protective mechanism against damage from intense acoustic stimuli—such as gunfire or explosions. Interestingly, this reflex can also be activated by the sound of one’s own voice.
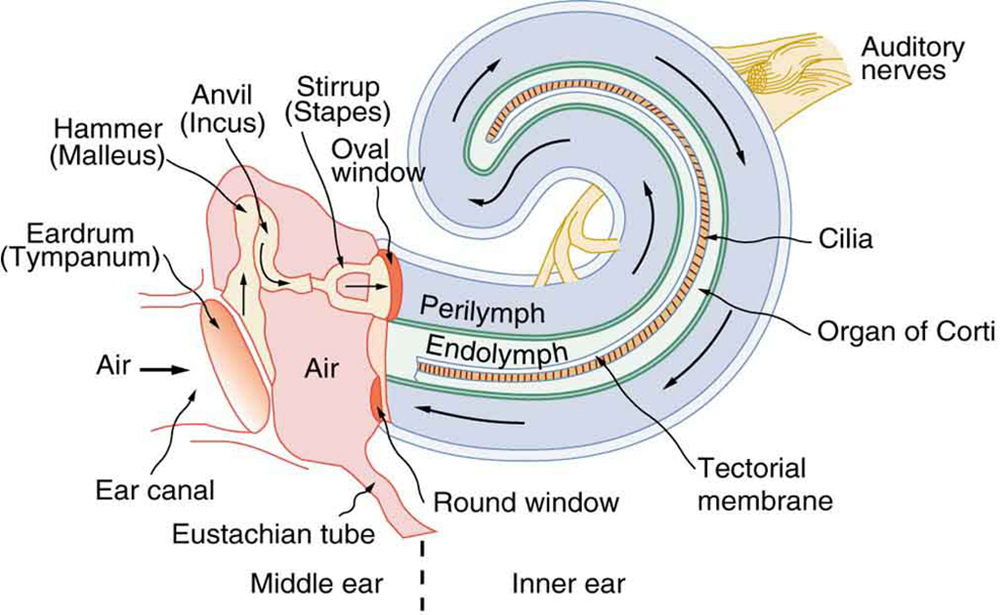
The inner ear, shown in greater detail in Figure 133.7, consists of the cochlea—a spiral-shaped, fluid-filled structure that converts mechanical vibrations into neural signals. Pressure waves from the oval window propagate through the fluid in the cochlea, displacing the basilar membrane and stimulating specialized sensory structures called hair cells. These cilia are embedded in the organ of Corti and interact with the overlying tectorial membrane. As the membrane vibrates, it bends the cilia, which triggers nerve impulses that travel to the brain via the cochlear nerve.
The cochlea is tonotopically organized, meaning different regions of the basilar membrane are tuned to specific frequencies. High-frequency sounds are detected near the base of the cochlea (closest to the oval window), while low-frequency sounds activate receptors near the apex. For frequencies below about 1000 Hz, the hair cells transmit nerve impulses that match the frequency of the incoming wave. For higher frequencies, the brain interprets pitch based on the specific region of the cochlea being stimulated.
Information about intensity is encoded both by the number of nerve fibers activated and the rate at which they fire. Additionally, timing and intensity differences between the ears are processed by the brain to determine the direction of the sound source. Higher-level auditory processing allows us to extract meaning from speech, appreciate music, and detect subtle emotional tones.
Hearing loss may result from damage to the structures of the middle ear or from neural damage in the cochlea. Conductive hearing loss, often due to problems in the middle ear, may be addressed by transmitting sound through bone conduction. Bone-conduction hearing aids bypass the ear canal and transmit vibrations directly through the skull to the cochlea.
Sensorineural hearing loss—caused by damage to the cochlear nerve or hair cells—cannot be reversed, but amplification can partially restore functionality. However, excessive amplification may lead to further damage. In cases where hair cells are nonfunctional but nerve pathways remain intact, cochlear implants can provide direct electrical stimulation to the auditory nerve. These devices are especially beneficial for individuals with profound hearing loss.
The modern cochlear implant was developed by Graeme Clark in the 1970s in Australia. It typically includes three external and two internal components. Externally, a microphone captures sound, a speech processor selects relevant frequencies, and a transmitter sends the signal to the internal components via electromagnetic induction. Internally, a receiver implanted beneath the skin converts the signal into electrical impulses, which are transmitted through a cable into the cochlea. An array of about 24 electrodes sends these impulses directly to the auditory nerve, effectively bypassing damaged hair cells and restoring a form of hearing.
Interactive Activity: Explore Your Own Hearing Threshold
Objective:
Use an online tool to generate your personal audiogram and reflect on your hearing sensitivity across different frequencies. This activity reinforces your understanding of sound perception and how hearing varies among individuals.
Instructions:
- Find a quiet environment and use wired headphones or earbuds for best accuracy.
- Go to the website: https://hearingtest.online
- Click “Start the Test” and follow the guided steps.
- After the test, your audiogram will be displayed showing hearing thresholds across frequencies.
- Take a screenshot or download the audiogram graph for your records.
- Complete the reflection questions below.
Reflection Questions:
- Describe your audiogram:
At which frequencies was your hearing most sensitive (lowest dB thresholds)? Were there any frequencies where your threshold was noticeably higher? - Compare to normal hearing:
Does your audiogram fall within the typical 0–20 dB threshold range at all frequencies tested? - Connect to the science:
Based on the chapter, how might age, past noise exposure, or other factors explain the shape of your audiogram? How might it compare to someone with presbycusis or noise-induced hearing loss?
Note: This hearing test is not a clinical assessment, but it provides valuable insights into your hearing profile.
Section Summary
- The range of audible frequencies is 20 to 20,000 Hz.
- Those sounds above 20,000 Hz are ultrasound, whereas those below 20 Hz are infrasound.
- The perception of frequency is pitch.
- The perception of intensity is loudness.
- Loudness has units of phons.
Conceptual Questions
- Why can a hearing test show that your threshold of hearing is 0 dB at 250 Hz, when Figure 133.3 implies that no one can hear such a frequency at less than 20 dB?
Problems & Exercises
- The factor of [latex]{\text{10}}^{-\text{12}}[/latex] in the range of intensities to which the ear can respond, from threshold to that causing damage after brief exposure, is truly remarkable. If you could measure distances over the same range with a single instrument and the smallest distance you could measure was 1 mm, what would the largest be?
- The frequencies to which the ear responds vary by a factor of [latex]{\text{10}}^{\text{3}}[/latex]. Suppose the speedometer on your car measured speeds differing by the same factor of [latex]{\text{10}}^{\text{3}}[/latex], and the greatest speed it reads is 90.0 mi/h. What would be the slowest nonzero speed it could read?
- What are the closest frequencies to 500 Hz that an average person can clearly distinguish as being different in frequency from 500 Hz? The sounds are not present simultaneously.
- Can the average person tell that a 2002-Hz sound has a different frequency than a 1999-Hz sound without playing them simultaneously?
- If your radio is producing an average sound intensity level of 85 dB, what is the next lowest sound intensity level that is clearly less intense?
- Can you tell that your roommate turned up the sound on the TV if its average sound intensity level goes from 70 to 73 dB?
- Based on the graph in Figure 133.2, what is the threshold of hearing in decibels for frequencies of 60, 400, 1000, 4000, and 15,000 Hz? Note that many AC electrical appliances produce 60 Hz, music is commonly 400 Hz, a reference frequency is 1000 Hz, your maximum sensitivity is near 4000 Hz, and many older TVs produce a 15,750 Hz whine.
- What sound intensity levels must sounds of frequencies 60, 3000, and 8000 Hz have in order to have the same loudness as a 40-dB sound of frequency 1000 Hz (that is, to have a loudness of 40 phons)?
- What is the approximate sound intensity level in decibels of a 600-Hz tone if it has a loudness of 20 phons? If it has a loudness of 70 phons?
- (a) What are the loudnesses in phons of sounds having frequencies of 200, 1000, 5000, and 10,000 Hz, if they are all at the same 60.0-dB sound intensity level? (b) If they are all at 110 dB? (c) If they are all at 20.0 dB?
- Suppose a person has a 50-dB hearing loss at all frequencies. By how many factors of 10 will low-intensity sounds need to be amplified to seem normal to this person? Note that smaller amplification is appropriate for more intense sounds to avoid further hearing damage.
- If a woman needs an amplification of [latex]5\text{.}\text{0}×{\text{10}}^{\text{12}}[/latex] times the threshold intensity to enable her to hear at all frequencies, what is her overall hearing loss in dB? Note that smaller amplification is appropriate for more intense sounds to avoid further damage to her hearing from levels above 90 dB.
- (a) What is the intensity in watts per meter squared of a just barely audible 200-Hz sound? (b) What is the intensity in watts per meter squared of a barely audible 4000-Hz sound?
- (a) Find the intensity in watts per meter squared of a 60.0-Hz sound having a loudness of 60 phons. (b) Find the intensity in watts per meter squared of a 10,000-Hz sound having a loudness of 60 phons.
- A person has a hearing threshold 10 dB above normal at 100 Hz and 50 dB above normal at 4000 Hz. How much more intense must a 100-Hz tone be than a 4000-Hz tone if they are both barely audible to this person?
- A child has a hearing loss of 60 dB near 5000 Hz, due to noise exposure, and normal hearing elsewhere. How much more intense is a 5000-Hz tone than a 400-Hz tone if they are both barely audible to the child?
- What is the ratio of intensities of two sounds of identical frequency if the first is just barely discernible as louder to a person than the second?
Glossary
- loudness
- the perception of sound intensity
- timbre
- number and relative intensity of multiple sound frequencies
- note
- basic unit of music with specific names, combined to generate tunes
- tone
- number and relative intensity of multiple sound frequencies
- phon
- the numerical unit of loudness
- ultrasound
- sounds above 20,000 Hz
- infrasound
- sounds below 20 Hz
the perception of sound
the perception of the frequency of a sound
the perception of sound intensity
number and relative intensity of multiple sound frequencies
basic unit of music with specific names, combined to generate tunes
number and relative intensity of multiple sound frequencies
the numerical unit of loudness
sounds above 20,000 Hz
sounds below 20 Hz
