
Thermodynamics
110 Introduction to the Second Law of Thermodynamics: Heat Engines and Their Efficiency
Learning Objectives
- Explain different formulations of the second law of thermodynamics.
- Calculate the efficiency and CO₂ emissions of coal-based power plants using second law principles.
- Define and describe the Otto cycle.

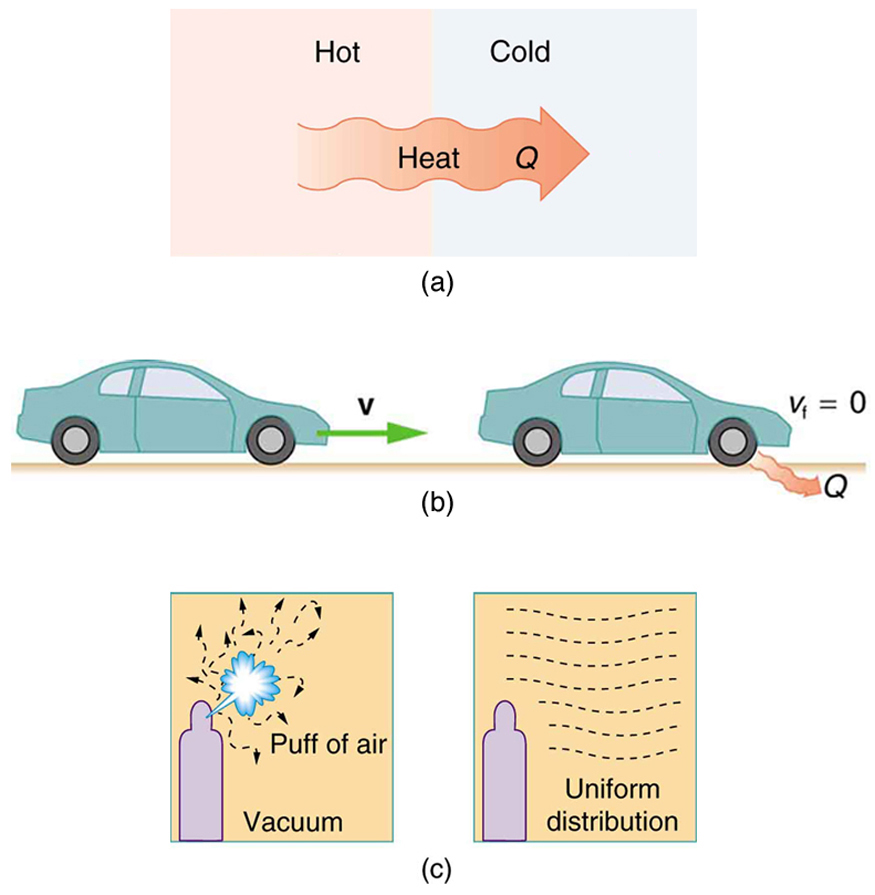
The second law of thermodynamics addresses the natural direction of spontaneous processes. Many natural processes are irreversible—they occur in only one direction. A dropped glass shatters but does not reassemble. Gas expands to fill a vacuum but does not spontaneously regroup. This irreversibility is not a violation of energy conservation (the first law); instead, it stems from statistical behavior on the molecular level.
In technical terms, an irreversible process is one that cannot return both the system and its surroundings to their original states via the same path. Common examples include:
- Heat spontaneously flowing from hot to cold, but never cold to hot.
- Mechanical energy (like that of a moving car) converting fully into thermal energy via friction, but never the reverse.
- Gas molecules spreading out in a vacuum but never naturally recollecting.
Although the first law of thermodynamics permits these processes, the second law forbids them. One formulation of the second law is as follows:
Second Law of Thermodynamics — First Expression
Heat transfer occurs spontaneously from hotter to cooler objects but never spontaneously in the reverse direction.
This can be restated: It is impossible for a process to result solely in the transfer of heat from a cooler to a hotter object.
Heat Engines
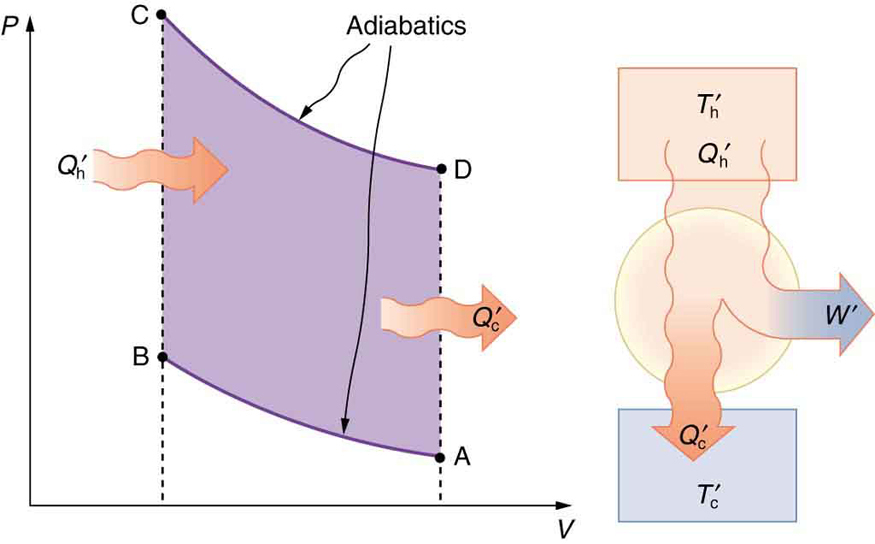
A device that uses heat to do mechanical work is called a heat engine. These include car engines, jet turbines, and power plant generators. A heat engine absorbs thermal energy [latex]{Q}_{\text{h}}[/latex] from a high-temperature reservoir, performs work [latex]W[/latex], and exhausts some energy as heat [latex]{Q}_{\text{c}}[/latex] to a low-temperature reservoir.
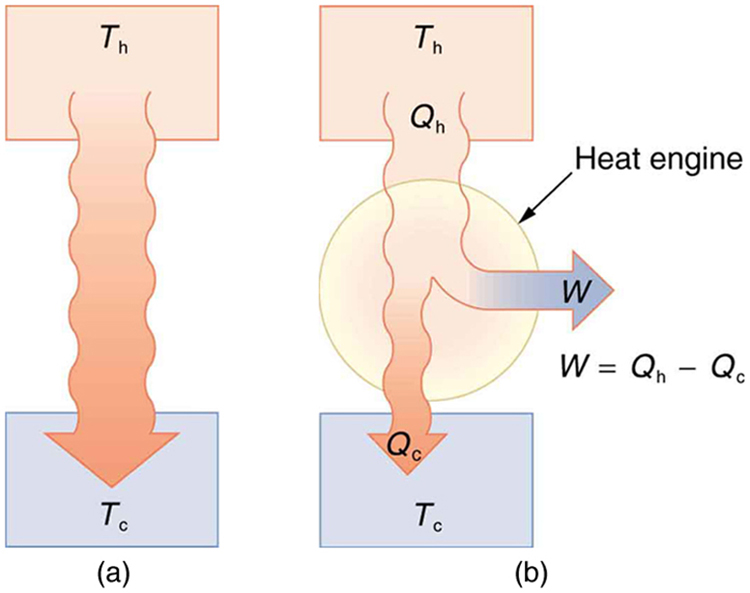
In a perfect engine, we would want all heat [latex]{Q}_{\text{h}}[/latex] to be converted to work, with none lost to the surroundings—that is, [latex]{Q}_{\text{c}} = 0[/latex]. But the second law rules this out:
Second Law of Thermodynamics — Second Expression
It is impossible to convert all heat from a reservoir into work in a cyclical process that returns the system to its original state.
A cyclical process is one where the system returns to its initial conditions after each cycle—like the repeated motion of a piston in a car engine. For such processes, the internal energy change is zero: [latex]\Delta U = 0[/latex]. From the first law of thermodynamics:
In heat engines, the total heat input [latex]Q[/latex] is the difference between the energy from the hot reservoir and what is lost to the cold reservoir:
This relationship shows that some energy is always lost as heat to the environment.
Efficiency of Heat Engines
The efficiency of a heat engine is defined as the ratio of work output to heat input:
Using [latex]W = Q_{\text{h}} - Q_{\text{c}}[/latex], we can also write:
Perfect efficiency (100%) would require [latex]Q_{\text{c}} = 0[/latex], which is not possible in real systems. Heat must always be exhausted somewhere, typically into the environment.
Example 110.1 Daily Work Done by a Coal-Fired Power Station, Its Efficiency and Carbon Dioxide Emissions
A coal-fired power station is a huge heat engine. It uses heat transfer from burning coal to do work to turn turbines, which are used to generate electricity. In a single day, a large coal power station has [latex]2\text{.}\text{50}×{\text{10}}^{\text{14}}\phantom{\rule{0.25em}{0ex}}\text{J}[/latex] of heat transfer from coal and [latex]1\text{.}\text{48}×{\text{10}}^{\text{14}}\phantom{\rule{0.25em}{0ex}}\text{J}[/latex] of heat transfer into the environment. (a) What is the work done by the power station? (b) What is the efficiency of the power station? (c) In the combustion process, the following chemical reaction occurs: [latex]\text{C}+{\text{O}}_{2}\to {\text{CO}}_{2}[/latex]. This implies that every 12 kg of coal puts 12 kg + 16 kg + 16 kg = 44 kg of carbon dioxide into the atmosphere. Assuming that 1 kg of coal can provide [latex]2\text{.}5×{\text{10}}^{6}\phantom{\rule{0.25em}{0ex}}\text{J}[/latex] of heat transfer upon combustion, how much [latex]{\text{CO}}_{2}[/latex] is emitted per day by this power plant?
Strategy for (a)
We can use [latex]W={Q}_{\text{h}}-{Q}_{\text{c}}[/latex] to find the work output [latex]W[/latex], assuming a cyclical process is used in the power station. In this process, water is boiled under pressure to form high-temperature steam, which is used to run steam turbine-generators, and then condensed back to water to start the cycle again.
Solution for (a)
Work output is given by:
Substituting the given values:
Strategy for (b)
The efficiency can be calculated with [latex]\text{Eff}=\frac{W}{{Q}_{\text{h}}}[/latex] since [latex]{Q}_{\text{h}}[/latex] is given and work [latex]W[/latex] was found in the first part of this example.
Solution for (b)
Efficiency is given by: [latex]\text{Eff}=\frac{W}{{Q}_{\text{h}}}[/latex]. The work [latex]W[/latex] was just found to be [latex]{\text{1.02 × 10}}^{\text{14}}\phantom{\rule{0.25em}{0ex}}\text{J}[/latex], and [latex]{Q}_{\text{h}}[/latex] is given, so the efficiency is
Strategy for (c)
The daily consumption of coal is calculated using the information that each day there is [latex]2\text{.}\text{50}×{\text{10}}^{\text{14}}\phantom{\rule{0.25em}{0ex}}\text{J}[/latex] of heat transfer from coal. In the combustion process, we have [latex]\text{C}+{\text{O}}_{2}\to {\text{CO}}_{2}[/latex]. So every 12 kg of coal puts 12 kg + 16 kg + 16 kg = 44 kg of [latex]{\text{CO}}_{2}[/latex] into the atmosphere.
Solution for (c)
The daily coal consumption is
Assuming that the coal is pure and that all the coal goes toward producing carbon dioxide, the carbon dioxide produced per day is
This is 370,000 metric tons of [latex]{\text{CO}}_{2}[/latex] produced every day.
Discussion
If all the work output is converted to electricity in a period of one day, the average power output is 1180 MW (this is left to you as an end-of-chapter problem). This value is about the size of a large-scale conventional power plant. The efficiency found is acceptably close to the value of 42% given for coal power stations. It means that fully 59.2% of the energy is heat transfer to the environment, which usually results in warming lakes, rivers, or the ocean near the power station, and is implicated in a warming planet generally. While the laws of thermodynamics limit the efficiency of such plants—including plants fired by nuclear fuel, oil, and natural gas—the heat transfer to the environment could be, and sometimes is, used for heating homes or for industrial processes. The generally low cost of energy has not made it economical to make better use of the waste heat transfer from most heat engines. Coal-fired power plants produce the greatest amount of [latex]{\text{CO}}_{2}[/latex] per unit energy output (compared to natural gas or oil), making coal the least efficient fossil fuel.
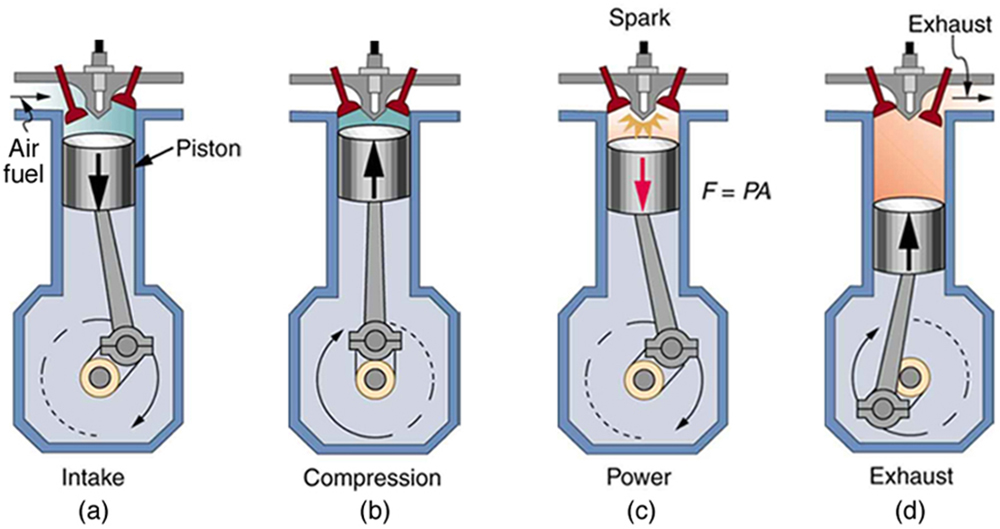
We can calculate the efficiency of a heat engine from energy values alone, but examining the internal mechanics of the engine—like those in a typical gasoline-powered car—reveals much more. Figure 110.4 shows the four steps of a four-stroke gasoline engine, which repeats the same cycle again and again to convert fuel into work.
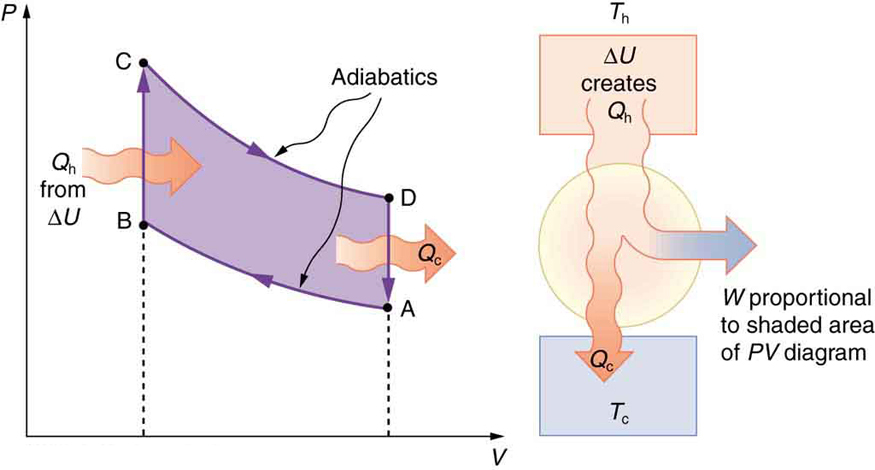
The thermodynamic cycle that underlies the four-stroke engine is called the Otto cycle, illustrated in Figure 110.5(a). Although the actual strokes in a car engine don’t follow these idealized paths exactly, the Otto cycle provides a useful approximation and helps explain where energy goes in the system.
Let’s walk through each segment of the Otto cycle:
- Path AB: This is an adiabatic compression. The air-fuel mixture is compressed rapidly in the engine cylinder, raising its pressure and temperature without significant heat transfer. Work is done on the gas.
- Path BC: Heat [latex]{Q}_{\text{h}}[/latex] is added at constant volume—this simulates the rapid combustion of fuel. Temperature and pressure rise sharply.
- Path CD: The high-pressure gas expands adiabatically, doing work on the environment (the power stroke in the engine). This is where the engine produces mechanical output.
- Path DA: Heat [latex]{Q}_{\text{c}}[/latex] is expelled at constant volume, reducing the gas temperature and pressure before the cycle repeats. This corresponds to the exhaust of hot gases and the intake of cooler air-fuel mixture.
The net work done by the engine is represented by the area enclosed by the ABCDA path in the PV diagram of Figure 110.5(a). The larger this area, the greater the energy converted into useful mechanical work. As shown in Figure 110.6, this work increases if the expansion (path CD) begins at a higher temperature and the compression (path AB) starts at a lower temperature.
As with all heat engines, the second law of thermodynamics applies: some heat must be expelled to a lower-temperature reservoir. The greater the difference between the high and low temperatures, the more efficient the cycle becomes.
Efficiency of the Otto Cycle
The net work output from a cyclical process like the Otto cycle is given by:
And the efficiency of the engine is:
This equation tells us that to increase efficiency, we must either reduce the heat lost to the cold reservoir or increase the heat input temperature. The temperature of the gas at the beginning and end of compression and expansion directly affects this efficiency, as visualized in the PV diagrams above.
Section Summary
- The two expressions of the second law of thermodynamics are: (i) Heat transfer occurs spontaneously from higher- to lower-temperature bodies but never spontaneously in the reverse direction; and (ii) It is impossible in any system for heat transfer from a reservoir to completely convert to work in a cyclical process in which the system returns to its initial state.
- Irreversible processes depend on path and do not return to their original state. Cyclical processes are processes that return to their original state at the end of every cycle.
- In a cyclical process, such as a heat engine, the net work done by the system equals the net heat transfer into the system, or
[latex]W={Q}_{\text{h}}–{Q}_{\text{c}}\phantom{\rule{0.25em}{0ex}}[/latex] , where [latex]{Q}_{\text{h}}[/latex] is the heat transfer from the hot object (hot reservoir), and [latex]{Q}_{\text{c}}[/latex] is the heat transfer into the cold object (cold reservoir). - Efficiency can be expressed as[latex]\text{Eff}=\frac{W}{{Q}_{\text{h}}}[/latex],the ratio of work output divided by the amount of energy input.
- The four-stroke gasoline engine is often explained in terms of the Otto cycle, which is a repeating sequence of processes that convert heat into work.
Conceptual Questions
- Imagine you are driving a car up Pike’s Peak in Colorado. To raise a car weighing 1000 kilograms a distance of 100 meters would require about a million joules. You could raise a car 12.5 kilometers with the energy in a gallon of gas. Driving up Pike’s Peak (a mere 3000-meter climb) should consume a little less than a quart of gas. But other considerations have to be taken into account. Explain, in terms of efficiency, what factors may keep you from realizing your ideal energy use on this trip.
- Is a temperature difference necessary to operate a heat engine? State why or why not.
- Definitions of efficiency vary depending on how energy is being converted. Compare the definitions of efficiency for the human body and heat engines. How does the definition of efficiency in each relate to the type of energy being converted into doing work?
- Why—other than the fact that the second law of thermodynamics says reversible engines are the most efficient—should heat engines employing reversible processes be more efficient than those employing irreversible processes? Consider that dissipative mechanisms are one cause of irreversibility.
Problem Exercises
- A certain heat engine does 10.0 kJ of work and 8.50 kJ of heat transfer occurs to the environment in a cyclical process. (a) What was the heat transfer into this engine? (b) What was the engine’s efficiency?
- With [latex]2\text{.}\text{56}×{\text{10}}^{6}\phantom{\rule{0.25em}{0ex}}\text{J}[/latex] of heat transfer into this engine, a given cyclical heat engine can do only [latex]1\text{.}\text{50}×{\text{10}}^{5}\phantom{\rule{0.25em}{0ex}}\text{J}[/latex] of work. (a) What is the engine’s efficiency? (b) How much heat transfer to the environment takes place?
- (a) What is the work output of a cyclical heat engine having a 22.0% efficiency and [latex]6\text{.}\text{00}×{\text{10}}^{9}\phantom{\rule{0.25em}{0ex}}\text{J}[/latex] of heat transfer into the engine? (b) How much heat transfer occurs to the environment?
- (a) What is the efficiency of a cyclical heat engine in which 75.0 kJ of heat transfer occurs to the environment for every 95.0 kJ of heat transfer into the engine? (b) How much work does it produce for 100 kJ of heat transfer into the engine?
- The engine of a large ship does [latex]2\text{.}\text{00}×{\text{10}}^{8}\phantom{\rule{0.25em}{0ex}}\text{J}[/latex] of work with an efficiency of 5.00%. (a) How much heat transfer occurs to the environment? (b) How many barrels of fuel are consumed, if each barrel produces [latex]6\text{.}\text{00}×{\text{10}}^{9}\phantom{\rule{0.25em}{0ex}}\text{J}[/latex] of heat transfer when burned?
- (a) How much heat transfer occurs to the environment by an electrical power station that uses [latex]1\text{.}\text{25}×{\text{10}}^{\text{14}}\phantom{\rule{0.25em}{0ex}}\text{J}[/latex] of heat transfer into the engine with an efficiency of 42.0%? (b) What is the ratio of heat transfer to the environment to work output? (c) How much work is done?
- Assume that the turbines at a coal-powered power plant were upgraded, resulting in an improvement in efficiency of 3.32%. Assume that prior to the upgrade the power station had an efficiency of 36% and that the heat transfer into the engine in one day is still the same at [latex]2\text{.}\text{50}×{\text{10}}^{\text{14}}\phantom{\rule{0.25em}{0ex}}\text{J}[/latex]. (a) How much more electrical energy is produced due to the upgrade? (b) How much less heat transfer occurs to the environment due to the upgrade?
- This problem compares the energy output and heat transfer to the environment by two different types of nuclear power stations—one with the normal efficiency of 34.0%, and another with an improved efficiency of 40.0%. Suppose both have the same heat transfer into the engine in one day, [latex]2\text{.}\text{50}×{\text{10}}^{\text{14}}\phantom{\rule{0.25em}{0ex}}\text{J}[/latex]. (a) How much more electrical energy is produced by the more efficient power station? (b) How much less heat transfer occurs to the environment by the more efficient power station? (One type of more efficient nuclear power station, the gas-cooled reactor, has not been reliable enough to be economically feasible in spite of its greater efficiency.)
Glossary
- irreversible process
- any process that depends on path direction
- second law of thermodynamics
- heat transfer flows from a hotter to a cooler object, never the reverse, and some heat energy in any process is lost to available work in a cyclical process
- cyclical process
- a process in which the path returns to its original state at the end of every cycle
- Otto cycle
- a thermodynamic cycle, consisting of a pair of adiabatic processes and a pair of isochoric processes, that converts heat into work, e.g., the four-stroke engine cycle of intake, compression, ignition, and exhaust
heat transfer flows from a hotter to a cooler object, never the reverse, and some heat energy in any process is lost to available work in a cyclical process
any process that depends on path direction
a process in which the path returns to its original state at the end of every cycle
a thermodynamic cycle, consisting of a pair of adiabatic processes and a pair of isochoric processes, that converts heat into work, e.g., the four-stroke engine cycle of intake, compression, ignition, and exhaust
