
The Scope of the Criminal Justice System
Before returning to the meat of criminal procedure law, let us consider for a moment just how large and important a system is being governed by nine Justices interpreting a handful of ancient clauses.
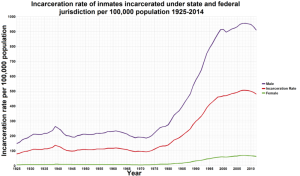
Beginning around 1970, the United States began a massive increase in incarceration. Between 1980 and 2010, the incarceration rate more than doubled. Despite a small drop in incarceration over the past decade, as of early 2018 the United States incarcerated about 2.3 million people, including inmates at prisons, local jails, and juvenile facilities, among other places. This chart (released to the public domain via Wikimedia Commons) shows how the incarceration rate (essentially, the number of inmates per 100,000 U.S. residents) was relatively flat for decades through the 1960s, began rising after 1970, and then increased rapidly after 1985. The rate has decreased slightly over the past few years.
Missouri’s 2018 incarceration rate (859 per 100,000 residents) is higher than the U.S. as a whole (698) and is tenth-highest among states. The states with the highest incarceration rates in 2018 were Mississippi (1,039), Louisiana (1,052), and Oklahoma (1,079). The states with the lowest rates were Rhode Island (361), Vermont (328) and Massachusetts (324). Even these states have higher incarceration rates than most countries, including Turkey (287), Iran (284), South Africa (280), Israel (265), New Zealand (220), Singapore (201), Poland (199), Jamaica (138), Iraq (126), France (102), and Ireland (81).[1] The overall U.S. rate exceeds every other country in the world.
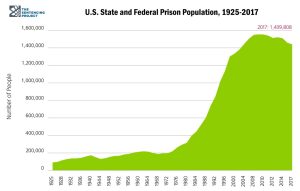
The next chart (provided courtesy of The Sentencing Project) shows the raw numbers of prisoners in America. Note that this does not include inmates in jails or juvenile facilities.
In Missouri, about 50,000 people are incarcerated, with 32,000 in state prisons, 11,000 in local jails, 5,600 in federal prisons, and 1,000 in facilities for youths.[2] Nationwide, the total prison and jail population as of December 31, 2016 was 2,162,400.[3] In addition, 4,537,100 persons were under supervision—on parole or probation—creating a total correctional system population of 6,613,500. Missouri’s total correctional population was 105,900.
Because states house the overwhelming bulk of U.S. prisoners, state budgets fund the overwhelming bulk of U.S. correctional expenses. In 1985—just before the American prison population began its sharp increase—states spent a combined $6.7 billion on corrections. By 1990, the cost had risen to $16.9 billion. It was $36.4 billion in 2000, $51.4 billion in 2010, and $57.7 billion in 2016.[4]
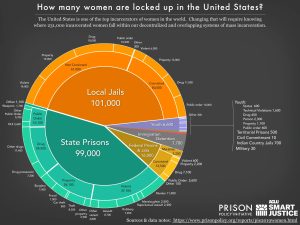
The next chart (provided courtesy of the Prison Policy Initiative) shows where incarcerated women are housed and what offenses led them to confinement.
[The PPI also has a chart entitled “The Whole Pie,” which covers all incarcerated persons, male and female. Although we lack permission to include the chart in this book, students may (and should) find it online:https://www.prisonpolicy.org/reports/pie2019.html.]
The likelihood of imprisonment is not distributed evenly among different groups of Americans. Women constitute about half of the total U.S. population but only 7 percent of the total prison population. Racial disparities are also stark. In 2016, state and federal jails and prisons housed (out of a total of 1,458,173 inmates) 486,900 black inmates (41 percent of the total), 439,800 white inmates (39 percent of the total), and 339,300 Hispanic inmates (17 percent of the total).[5] According to Census data taken around the same time (July 1, 2017), 77 percent of Americans described themselves as white alone (no other race), 13 percent as black or African American alone, 3 percent as two or more races, and 18 percent as Hispanic or Latino.[6] Although the demographic definitions—particularly for deciding who counts as Hispanic—used in various surveys are not always identical, the results are clear. Black and Hispanic Americans are significantly overrepresented among prisoners.
Despite the high U.S. incarceration rate, most Americans will never serve time. Instead, the majority of Americans encounter the justice system through their interactions with police officers. U.S. law enforcement agencies employ about 650,000 officers at the local, state, and federal level. That works out to about one officer for every 500 Americans. In 2014, officers performed about 11.2 million arrests. As was noted for incarceration, arrest rates exhibit disparities by race and sex. The 2014 arrests included 7,771,915 arrests of whites and 3,115,383 of blacks. About 3 million of the arrests were of women, compared to 8.2 million arrests of men. Young men are especially likely to be arrested.[7]
When suspects are arrested and prosecuted, states often provide legal counsel because the defendants otherwise could not afford it. In Missouri, the fiscal year 2018 budget allocates $46.3 million for the public defender system, which represents about $7.13 per Missourian. The per capita expense on indigent defense varies tremendously among states. For example, in 2017 Wisconsin spent $86 million, or $14.83 per resident. That same year Texas spent $37 million, or $1.31 per resident.
[1] See Prison Policy Institute, “States of Incarceration: The Global Context 2018,” at https://www.prisonpolicy.org/global/2018.html
[2] See Prison Policy Initiative, “Missouri Profile.”
[3] For national statistics, see Bureau of Justice Statistics, “Correctional Populations in the United States, 2016” (April 2018, NCJ 251211).
[4] See Sentencing Project, “Trends in U.S. Corrections.”
[5] See Bureau of Justice Statistics, “Prisoners in the United States” (January 2018, NCJ 251149).
[6] See US Census Bureau, “Quick Facts.”
[7] For arrest data, see Bureau of Justice Statistics, “Arrest Data Analysis Tool.”
