
11 Population Growth
Andrea Bierema
Learning Objectives
Students will be able to:
- Define population.
- Describe common population growth models.
- Define carrying capacity.
- Provide accurate explanations of population growth graphs, including carrying capacity.
- Define and identify examples of density-independent and density-dependent factors.
- Explain how population growth data plays a role in conservation.
- Draw connections between human population growth and social/political and economic conditions.
Population Ecology
Ecology is studied at different scales, and population growth is part of the “population ecology” scale.
Graph Interpretation
Exercise: Graph Interpretation
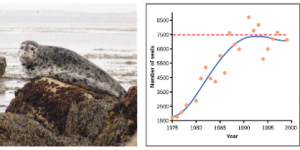
Population growth, a common topic in population ecology, plots population size over time on a graph. Before learning about population growth, let’s test your graph reading skills.
Exercise: Population Growth Graph
Now, let’s read a population growth graph:
Population Growth
There are two main models used to describe how population size changes over time: exponential growth and logistic growth. Click on the information hotspots (labeled as “i”) in the figure below to learn more.
Although several populations in nature follow logistic and exponential growth patterns, population growth can be much more complicated. For instance, many insects undergo brief exponential growth, followed by periods of mass death (or drop in population).
Example
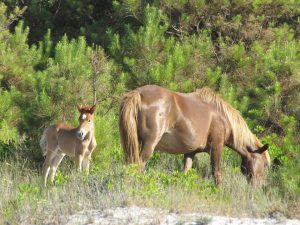
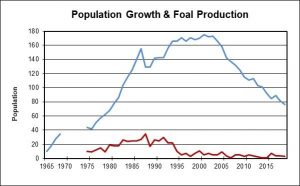
Population growth may not look like either exponential or logistic growth models. For instance, the horse population on Assateague Island in Maryland (pictured below) experienced increase and stabilization—similar to logistic growth—but then underwent a stable decline.
To complicate the interpretation of this graph further, the stabilization and decline were due to human management of the population. Studies showed that the environment would not sustain such a large population over time, and many of the plant-species’ population growth would drop dramatically—eventually causing a crash in the horse’s population size. Managers injected female horses with a vaccine that caused immune cells to attack sperm cells.
Check out the following article to learn more!
National Park Service. (n.d.). Resource management brief – horses. Retrieved June 24, 2020 from https://www.nps.gov/asis/learn/nature/resource-management-brief-horses.htm
Practice
Can you identify the carrying capacity in these populations of the fictitious smiling rainbow fish?
Population Density
Although examining how the size of the population changes over time is informative, it neglects to take into account how much space the population is occupying. How dense a population is can impact survival and be influenced by a number of factors.
Density
You may have heard of density in a chemistry or physics class before. In those cases, density typically refers to how dense an object is (as seen in the figure below). This is the amount of matter in a given volume (calculated by mass/volume).


Population density is similar to object density, except it refers to the number of individuals (or organisms) instead of the number of particles.
Population Growth Factors
Factors that influence population size, such as a drought or drop in prey, are categorized into one of two types:
Based on those definitions, identify each factor as density-dependent or independent.
Population Growth and Conservation
Population growth is used to inform conservation—whether it be to determine if conservation efforts are needed (i.e., a population is dropping in size) or testing to see if a conservation strategy is working.
Exercises
View the following interactive video to learn about lion conservation in Gorogonsa National Park and practice some of the population growth concepts!
For closed captioning or to view the full transcript see the video on YouTube. Or click on the “YouTube” link in the video.
Need more practice and information? Go through the Connecting Concepts interactive lesson on population dynamics, which describes population growth trends of zebra mussels and elephants!
Human Population
For closed captioning or to view the full transcript see the video on YouTube. Or click on the “YouTube” link in the video.
The previous video explored why our population is increasing in size, but when did our population start increasing and what does it look like now? The following video does an excellent job of showing how our rate of increase has changed over time. Note: It’s going to seem like not a lot is going on for a while, but keep watching!
More Information
How do your personal habitats and way of life impact the planet? How many Earths would we need if everyone lived a similar way as you? Find out by taking this ecological footprint quiz!
Next, find out your water footprint. You’ll be surprised by how many things that we do use water!
Reference
National Park Service. (n.d.). Resource management brief – horses. Retrieved June 24, 2020 from https://www.nps.gov/asis/learn/nature/resource-management-brief-horses.htm
