
8 Systems Thinking and the Carbon Cycle
Andrea Bierema
Learning Objectives
Students will be able to:
- Describe systems thinking.
- Identify and describe a system that is observed in the natural world.
- Apply systems terminology (e.g., closed and open system, reservoir, and flux) to the structure of a systems model, including the carbon cycle.
- Identify the characteristics of positive (reinforcing) and negative (balancing) feedbacks in systems model output.
- Convert information into a carbon cycle model to illustrate the relationships of components within a system.
- Use a carbon cycling system model to predict how a carbon molecular travels through the earth’s four spheres.
- Estimate residence time for a system in equilibrium.
Systems Thinking
A system is a set of components that are linked through interconnections and functions to create an outcome. The interconnections of components and their interactions create system behavior. This is a broad definition and it describes systems in biology (like the circulatory system or nutrient cycling), a game system (like chess, cards, or football), and even a social system (such as 4H or Girl Scouts).
Example
For example, a football team is a system with:
Systems thinking is one way of cognitively framing how we examine the world around us. In contrast to the more common mechanistic or deterministic model that analyzes and understands the whole as the sum of its parts, systems thinking moves the focus of analysis away from the parts themselves and instead concentrates on understanding how the different parts interact with each other.
This is a fundamental difference from traditional analysis (analysis means to break into constituent parts); systems thinking works “by expanding its view to take into account larger and larger numbers of interactions” as a system is being studied (Aronson 1996).
Example
Here is a classic example to show the difference between traditional analysis and systems thinking.

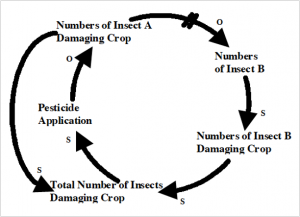
“If you apply pesticide, it will kill insect A which is damaging the crops. If you get more insects, apply more pesticide…”
If it were that simple, as the top figure suggests, we’d have no crop losses. Looking at the problem from a broader perspective, we can see one reason why the application of more pesticide doesn’t have the expected outcome. As seen in the second figure below, the total numbers of insect A are competing with insect B and keeping the population in check. When Insect A is exterminated, insect B’s population explodes, and they fill the niche of insect A.
The components and interactions in a system are referred to by the scientific terms used in system analysis
Now to introduce some important system science concepts. Scientists describe the “container” that holds an Earth material as a reservoir and the interactions as fluxes.
Exercise
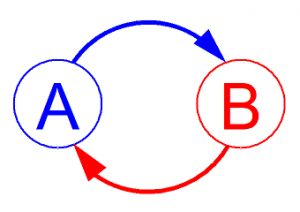
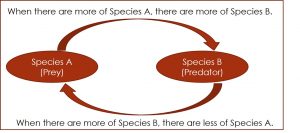
A feedback loop exists between two components/reservoirs of a system (labeled “A” and “B” below) when each affects the other.
Let’s look at this concept closer with an example. The following is a slideshow—move the slides with the arrows at the bottom of the slideshow.
Example
The Carbon Cycle
According to the Law of Conservation of Mass, matter can be neither created nor destroyed. Therefore, when nutrients (i.e., matter) are melted, burned, etc., they aren’t destroyed. Also, when more nutrients appear in one part of the earth, it was not created. Rather, nutrients cycle through different parts of the earth. Nutrient cycling is a system with fluxes and reservoirs.
Example
Here is an example of a typical carbon cycle. Apply the concepts learned in the previous section to the carbon cycle using the following diagram.
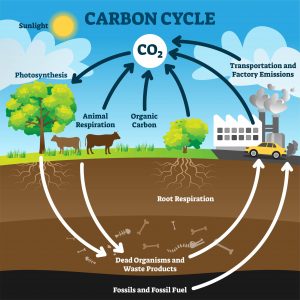
The diagram in the example box above is similar to how carbon cycles are drawn in biology textbooks. It is technically a system but does not explicitly illustrate how carbon moves through Earth’s four spheres, as depicted below.
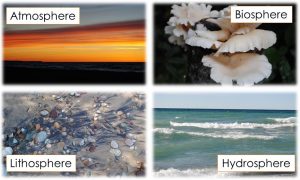
The following activity will end with a carbon cycle that focuses on these four spheres.
Exercise
The following is a list of 14 processes describing how carbon moves (i.e., the fluxes of the carbon cycle). Refer to the definitions of each of these processes while performing the activity below.
Using the definitions of each carbon flux above, develop a carbon cycle model. In the model below, each corner is one of the spheres (e.g., atmosphere), and each arrow represents a flux, which is the movement of carbon from one sphere to another sphere. Notice that one of the arrows (between the atmosphere and hydrosphere) is a double arrow; one of the fluxes represents carbon moving back and forth between the atmosphere and hydrosphere.
To complete the model below, drag each carbon flux (on the right side of the activity) to its appropriate arrow. Every carbon flux (e.g., photosynthesis) will match to one arrow and there are no extra arrows in the model. The two red, dotted-line arrows are human activities, and the black solid-line arrows are natural processes.
Alternatively, feel free to complete the activity below the carbon cycle model, which addresses the same information, but in sentence form.
This activity meets the same objectives as above, but just in a different format. Feel free to do this one instead or do it before creating the visual model above.
Potential Carbon Molecule Paths
As seen in the above activity, there are many ways in which carbon moves through the earth’s spheres. To combine the ideas of the first carbon diagram shown earlier and the created carbon model, consider what are the more specific reservoirs of carbon in each sphere. For instance, the first model shows trees and cows, which are in the biosphere, and fossil fuels used by factories and cars, in which fossil fuels are part of the lithosphere.
Exercises
Here’s one example of how a carbon molecule may travel through the cycle:
Here’s another example; this time moving through all four spheres:
Residence Time
Residence time is the average amount of time that matter remains in a reservoir. For carbon, this varies rather dramatically from sphere to sphere.
How to calculate residence time, assuming equilibrium in fluxes adding to, and fluxes removing, carbon from a given sphere:
Residence Time = [Amount of substance in sphere] / [total flux in OR out]
For example, if the total amount of carbon in a sphere is 8 billion tons and total flux in or out of the sphere is 4 billion tons per year:
[8 billion tons of carbon] / [4 billion tons per year] = 2 years
The conclusion to be made from this residence time example is that one atom of carbon will be in the given sphere for an average of 2 years before moving naturally to another sphere in the carbon system. Remember that this is an average; some atoms will spend much less time, and some will spend much more, in the sphere.
Exercise
Here is the total amount of carbon in each sphere:
- Biosphere: 605 billion tons
- Atmosphere: 760 billion tons
- Hydrosphere: 39,000 billion tons
- Lithosphere: 40,005,600 billion tons
Reference
Aronson, D. (1996). Overview of systems thinking. Retrieved from http://www.thinking.net/Systems_Thinking/OverviewSTarticle.pdf
Attributions
This chapter is a modified derivative of the following articles:
“Development and Evaluation of an Inquiry-Based Unit for Teaching about Paleoclimate and Climate Change” by Barone, S., Master’s Theses, 113, 2019, Used with permission.
“Introductory system slides.” by Gilbert, L. In Systems Thinking, InTeGrate, CC BY-NC-SA 3.0.
“Unit 2 pre-class homework tutorial.” by Low, R. In The Wicked Problem of Global Food Security, InTeGrate, CC BY-NC-SA
