
6 Protein Structure and Chromosome Model of Gene Expression
Learning Objectives
- Explain how a protein’s primary structure is related to its tertiary structure
- Develop a model to show the flow of information in gene expression
- Use your model to explain the flow of information and how different genes produce different proteins
- Explain how a change in a gene can lead to a change in protein function and potentially a disease
In Chapters 4 and 5, we learned about the process by which proteins are made, using the information in DNA that is transferred to RNA. Now, let’s think about how that protein contributes to phenotypes (traits) in the cell, which requires knowledge from chapters 2 and 3 as well to learn how proteins obtain their structures, which in turn relates to functions of proteins. Recall from chapter 3 how the structure of everyday object supports its function, in this case, a key fitting into a lock (Figure 3.1). Figure 6.1 shows two additional examples—a Phillips screwdriver to turn a screw, or a puzzle piece that fits into a gap to complete the puzzle (Figure 6.1a and b). In all cases, the shapes are complementary, or fit together, to allow some action or process to occur.
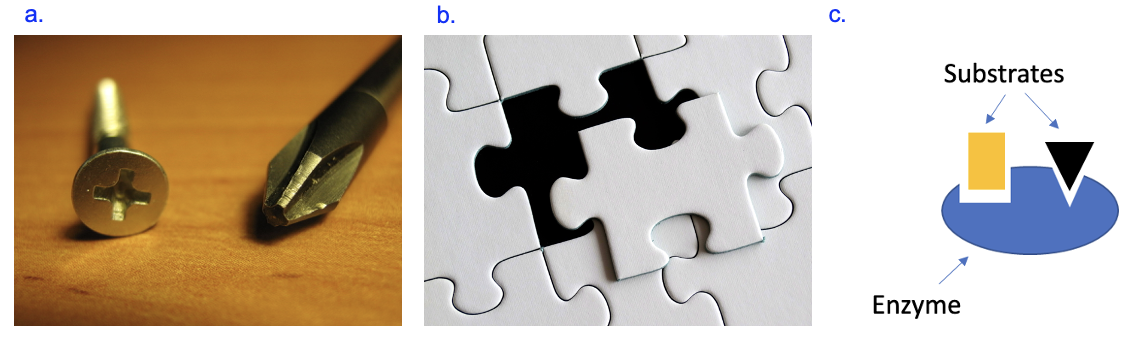
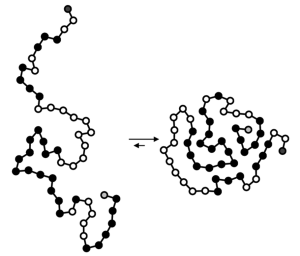
In Figure 6.1c, we have a biological example of an enzyme (blue blob), which is a type of protein that facilitates a chemical reaction. To catalyze the reaction, the enzyme must first bind to (interact with) the substrates, or reactants, for the reaction. The enzyme’s shape changes slightly after binding to the substrates to allow the chemical reaction occur. So how does the enzyme get its shape, which creates binding sites that are complementary to specific substrates? We already know that proteins are chains of amino acids, which were specified by the genetic information and produced by gene expression. However, this chain of amino acids, or polypeptide, is not functional yet. To carry out its function, the polypeptide needs to fold into a 3-dimensional structure with the specific shape that will allow that protein to interact with other specific molecules. This often involves interactions between amino acids that are far apart from each other in the chain before folding (Figure 6.2). The folding is driven by the properties of peptide bonds that connect amino acids, the specific amino acids in the chain themselves, and the environment in which the protein folds.
Chapter Outline
Section 6.1 Levels of Protein Structure
Section 6.3 Gene Expression and Chromosomes
Section 6.4 DNA Sequences and Disease
Section 6.1 Levels of Protein Structure
For an overview of protein structure, please watch this video and then continue with this reading:
Primary Protein Structure
To help understand how proteins achieve their 3D shape, we classify different types of interactions as protein structural levels. The first level is primary structure, which is the sequence of amino acids joined by peptide bonds. The amino acid sequence is determined by the DNA code, and is the only level of protein structure we can predict with high accuracy (other levels of structure need to be experimentally determined). Why does it matter which amino acids are added to the chain? Well, as Figure 6.3 shows, all amino acids have the same basic structure but differ in their R groups (also known as side chains), so this is how amino acids are classified. If you look at the category of amino acids labeled “nonpolar, aliphatic” or “nonpolar, aromatic,” what do you observe? These R groups are almost entirely made up of carbon-hydrogen and carbon-carbon bonds, which are nonpolar. Would the R groups of these amino acids interact well with water? Definitely not! You could also categorize these amino acids as “hydrophobic,” due to their tendency to avoid interactions with water. Interestingly, about half of the amino acids specified in the genetic code are hydrophobic.
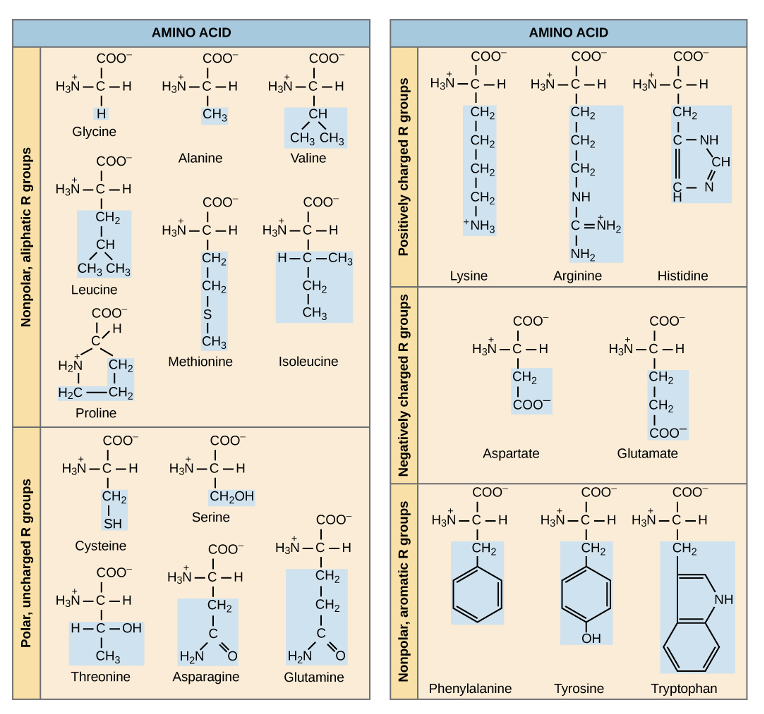
Contrast the structure of these nonpolar amino acids with those labeled “polar, uncharged” in Figure 6.3. What functional groups are observed in the R groups of these amino acids? Well, in many cases, we see nitrogen and/or oxygen, which we know to be highly electronegative, creating polar covalent bonds. These polar uncharged amino acids, as well as the polar, charged amino acids have R groups that interact well with water.
Tips for classifying amino acids
You may have noticed that some amino acids, such as lysine, are classified as polar and charged. Lysine’s R group contains a positively charged amino group, which fits with this classification, but it also has several CH2, or methylene, groups with entirely nonpolar covalent bonds. When classifying amino acids, it helps to think about the strongest possible noncovalent interaction that the atoms of this R group can form. The charged amino group forms ionic interactions, while the methylene groups at best can interact with hydrophobic clustering. Review Chapter 2, Section 2.4—which of these is stronger? The stronger interaction will be more influential in driving the behavior of this amino acid side chain, so if it is possible for the charged amino group to form an ionic or even ion-dipole interaction, that is much more stabilizing than hydrophobic clustering interactions.
Secondary Protein Structure
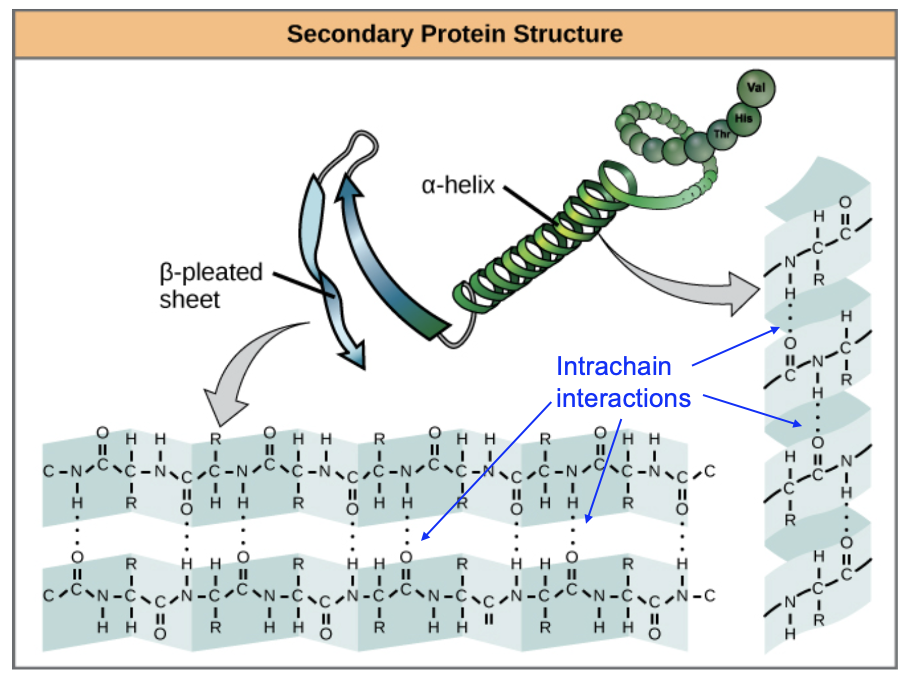
As the protein starts to fold, small structures that we find in many proteins start to emerge. These secondary structures are alpha helices, or coils, and beta sheets. These form due to the specific properties of the atoms in the peptide bond. Review Figure 6.4, which we also saw in Chapter 3.
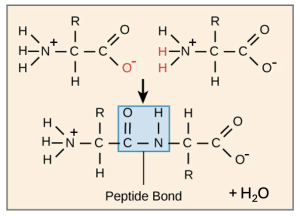
The amide group (containing a carbonyl group and an amino group) is created by the formation of the peptide bond, and contains only polar covalent bonds in which the atoms have partial charges. If this protein folds in a specific way, atoms in one part of the chain can interact with different parts of the chain using hydrogen bonding. The coiled structure of the alpha helix allows for many stabilizing hydrogen bond interactions, while in a beta pleated sheet, hydrogen bonding interactions occur as the length of one part of the chain interacts with another length of the same chain (Figure 6.5). Importantly, only the peptide bond atoms that are part of every protein, not atoms of the R group, form these secondary structures. This helps explain why these structures are observed across many different types of proteins and are their own structural category.
Tertiary Structure
The tertiary structural level is the folding of a protein to achieve a specific three-dimensional shape that is associated with the protein being able to carry out its function. The folding that occurs is necessary to bring together key amino acids that might otherwise be far apart in the chain, and give the protein a shape that allows it to interact with other molecules to carry out its function.
Figure 6.6a is a model showing the tertiary structure, or the functional, 3D structure of a protein named green fluorescent protein, or GFP. We can see that beta sheets are most of the structure, forming a cylinder, with a few short alpha helices visible as well. While the formation of these secondary structures is driven by hydrogen bonding interactions among peptide bond atoms, the overall 3D shape relies on more diverse interactions among the R groups of amino acids (intramolecular interactions), among R groups and atoms in the polypeptide backbone, and interactions between the polypeptide and its environment.
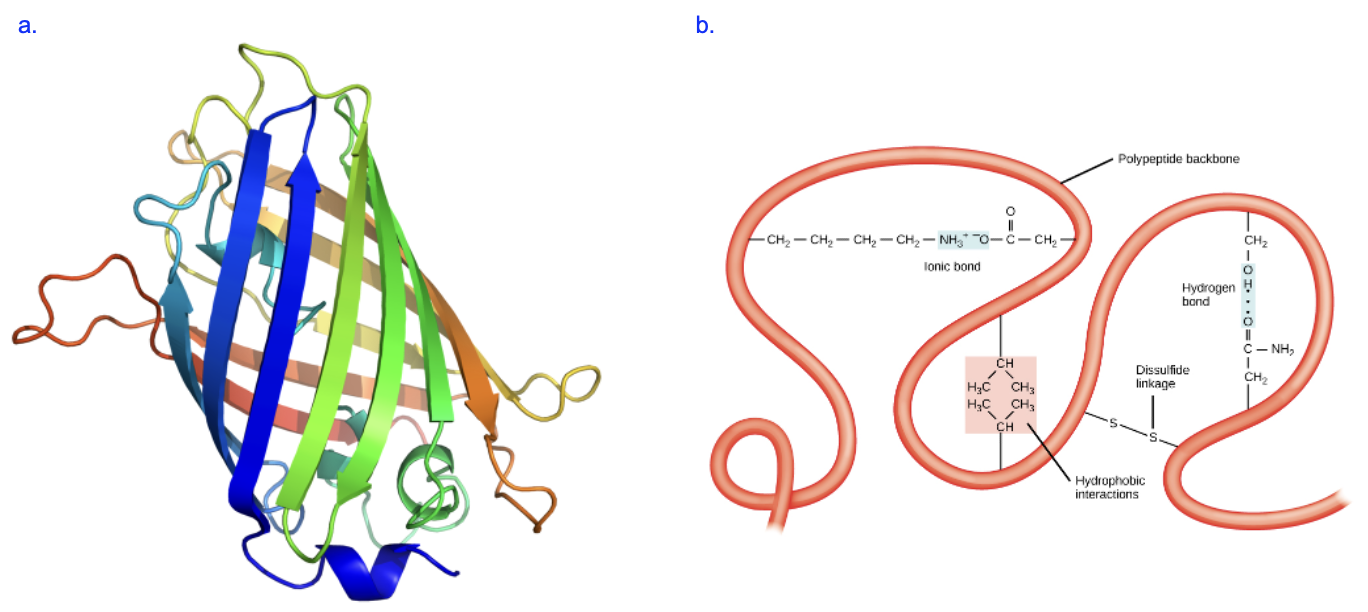
These include all the noncovalent interactions mentioned in Chapter 2, such as ionic bond interactions, hydrogen bond interactions, and hydrophobic clustering, and one type of covalent bond called a disulfide bridge. Examples of each of these are shown in Figure 6.6b. Compare the R groups with Figure 6.3—what amino acids are interacting in each case? Can you explain why certain groups interact with ionic bond interactions, hydrogen bond interactions, or hydrophobic clustering?
The folding of a protein is also dependent on its environment. Remember that living systems are primarily aqueous—full of water—and that has a strong influence the behavior of biological molecules. Most proteins are globular in shape, like a ball. On the surface of that ball, would you expect to see amino acids with R groups that are nonpolar or polar? What about in the core of protein, shielded from the outer environment? Amino acids on the surface of the protein, facing the aqueous surrounding environment, will be exposed to water and other polar molecules. When the protein folds, amino acids that interact with water (polar amino acids) will form stabilizing interactions that help keep those amino acids on the surface. Meanwhile, nonpolar amino acids that cannot interact well with water will be more stable when they are on the interior of the protein. This hydrophobic effect on protein folding is very influential for proteins to achieve and maintain their functional, 3D shapes.
Keep in mind that while a cellular environment is overall aqueous, some parts are very different in their properties. Proteins are also found in membranes, where there are many nonpolar fatty acid tails. What amino acids would you likely find on the surfaces of these proteins, interacting with the nonpolar fatty acid tails of membrane lipids?
Try this protein folding simulation!
You can explore protein structure interactively with the protein folding simulation linked out below. You can change the environment or change the properties of the amino acids in the chain. If you find that two different parts of the chain interact, look back at your amino acid structures (Figure 6.3) and your notes on interactions from Chapter 2 to help build an explanation for the interaction.
Quaternary Structure
The GFP protein described earlier is functional as a single protein. However, some proteins require multiple pieces, or subunits, to carry out their functions in cells. RNA polymerase is one example we have already discussed, and has multiple protein subunits, each encoded by a different gene, that assemble into a complex to carry out transcription. This is referred to as quaternary structure. In this case, the different subunits rely on many weak, noncovalent interacts to stabilize the overall structure.
Another protein showing quaternary structure is hemoglobin, which has four total subunits produced by expression of two different genes, alpha and beta hemoglobin (Figure 6.7). Only in this quaternary structure form is hemoglobin able to bind and carry oxygen in the blood. (Note—the Greek letters “alpha” and “beta” were used earlier to describe specific secondary structures, and but here they have been used to describe subunits in quaternary structure. While it may be confusing at first to see these same letters again, the contexts are different and so is the meaning of these terms.)

Section 6.2 Denaturation
If proteins require a specific, three-dimensional structure to carry out their function, then it follows that conditions that disrupt the protein structure would also disrupt protein function. And since much of protein structure is based on weak, noncovalent interactions, heat energy input can easily overcome these. If you’ve ever fried an egg, you’ve carried out protein denaturation by virtue of applying heat to the eggs. Likewise, changing the pH can also cause proteins to denature, since electrostatic interactions are affected by the changing H+ concentrations.
Most of the proteins in our cells, as well as the proteins of bacteria cells that reside in our body, function well at typical body temperature (37°C) and near neutral pH. However, bacteria have been found living in extreme environmental conditions, including the hot springs at Yellowstone National Park where temperatures are near boiling. Clearly, their proteins are capable of remaining functional at temperatures that would destroy our proteins!
Section 6.3 Gene Expression and Chromosomes
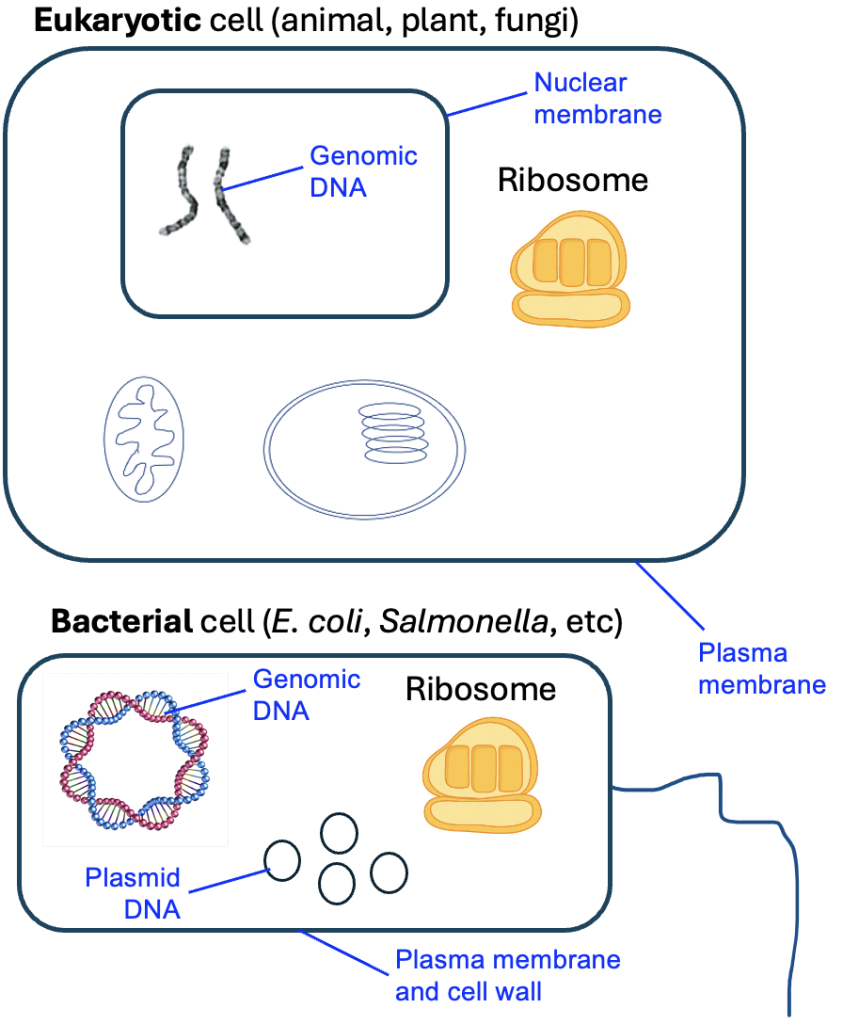
A common way to synthesize and link together knowledge is to build models of biological processes. Now that we have studied the process of gene expression in detail, let’s think of how we might visually represent the flow of genetic information that occurs in gene expression. To be more accurate to the context of genetic information as it is found in cells, our model should start with the larger structure that houses the genetic information, which is a chromosome. A chromosome is a structure of DNA and proteins, and for this chapter, we will focus on the DNA component. In eukaryotes, the chromosomes are linear pieces of DNA, while in bacteria, the DNA is circular (Figure 6.8). Different species of eukaryotes can also vary in the number of chromosomes, ranging greatly in number from one organism to the next (human cells have 23 pairs). Meanwhile, bacteria have one large genomic chromosome, but can also have many smaller circles of DNA called plasmids.
In our models of eukaryotic cells, we will often draw just one or a few chromosomes, using simple rectangles to depict the overall structure. In Figure 6.9, we have a representation of a chromosome with one gene, shown by the shaded box. This is meant to represent that a gene encoding a trait is at that physical location on the chromosome. While this model only shows one gene, chromosomes typically have thousands of genes. This model also doesn’t give any physical dimensions, but DNA sequences are typically measured in base pairs. In human cells, chromosomes lengths vary between 50 and 200 million base pairs. This model also shows the centromere, which is a repetitive sequence of DNA that plays a key role in cell division. In this model, however, it’s just a landmark and a feature that we might use to distinguish one chromosome from another.
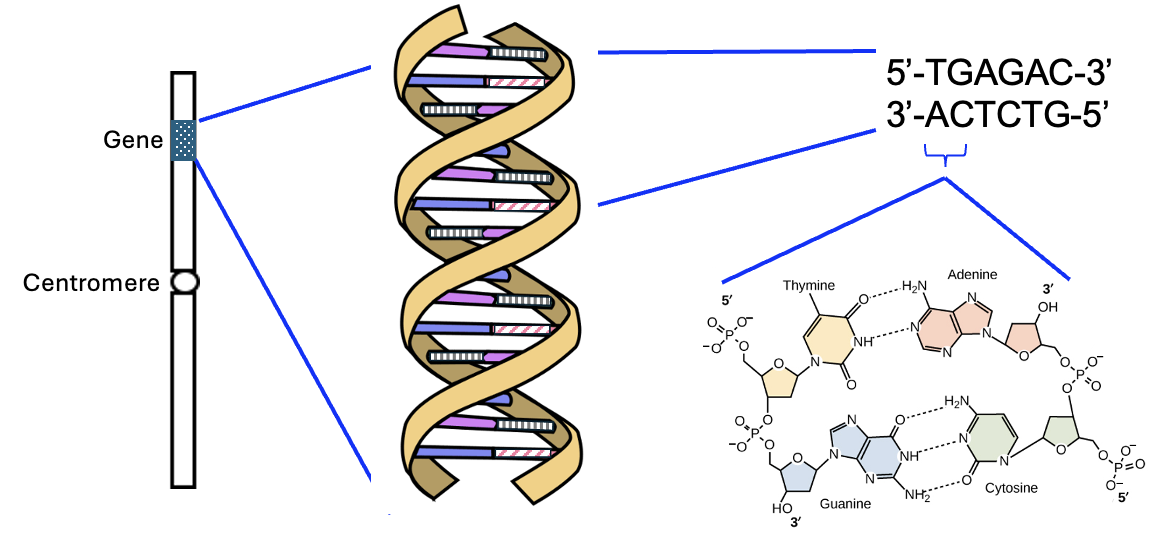
As with other models, even though the chemical details are not depicted, please remember that the rectangle represents the DNA double helix (two strands of DNA in which the bases of the two strands interact), and the letters of a DNA sequence represent the nucleotides, with 5’ and 3’ representing the 5’ phosphate and 3’ hydroxyl parts of a nucleotide or strand (Figure 6.9).
This representation might be different from your mental model of a chromosome, which might be more like an “X” structure. If so, that’s okay because a lot of images of chromosomes are taken of cells during the process of cell division, which requires replicating, or making a copy of, their DNA to then be divided when the cell divides. The “X” has twice as much DNA than in our chromosome model, and the two double helices in the X are attached to each other at their centromeres until very late in cell division. For this model, our focus is representing the non-replicated DNA in eukaryotic cells that are not currently undergoing cell division.
Let’s examine one such model and use it to show the process of gene expression. Consider drawing this out for yourself on a blank paper. Figure 6.10 shows a chromosome with a single gene labeled, Gene Z, along with the centromere. Also shown is a short DNA sequence from the middle of Gene Z that represents the template DNA strand.
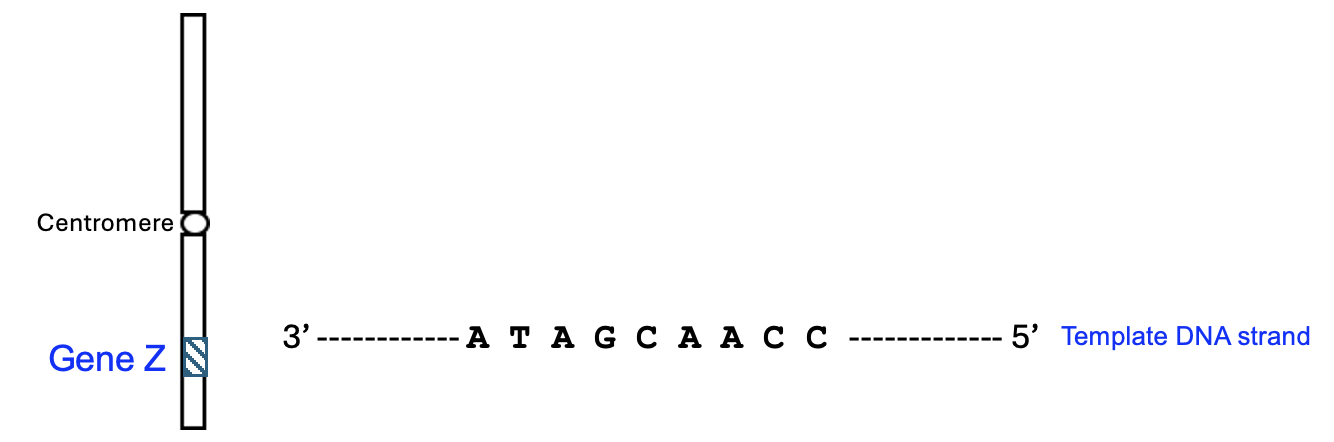
To make this model more accurate, the first thing we need to do is to write out the other strand of DNA. Remember, DNA in cells is a double helix, and there is a non-template strand that is complementary and anti-parallel with this template strand. Can you determine the non-template strand sequence, with the correct 5’ and 3’ ends?
Now let’s model the process of gene expression. Which step happens first—transcription or translation? Transcription of DNA happens first to produce the RNA, and translation uses the RNA to make a protein (hint: transcription comes before translation in the dictionary too!). Which strand is used to create the RNA—the template or non-template strand? It’s the template DNA strand that is used to build an RNA molecule, and the template DNA strand transfers information to the RNA strand through base pairing. Therefore, the RNA strand needs to be complementary and anti-parallel to the template DNA strand. Also, remember that while DNA has A, C, G, and T nucleotides, RNA uses A, C, G, and U nucleotides. Can you determine the RNA strand sequence, with the correct 5’ and 3’ ends?
Through transcription, we have our RNA strand sequence, and we can proceed to the translation step. Usually, we would begin by looking for a start codon to set the reading frame. However, in this case, the provided sequence is from the middle of the gene, so we can assume the sequence has in-frame codons (this is also why we didn’t look for a promoter before the transcription step). Based on the RNA sequence, how many amino acids are encoded? Can you use the genetic code table in Figure 5.2 to determine the amino acid sequence? Remember that amino acid sequences are written from N terminus to C terminus.
Reflect and synthesize!
Take a moment to reflect on the gene expression process. What do the steps have in common, and how do they vary? How is information transmitted in each step, and what covalent bonds and intermolecular forces are involved?
Section 6.4 DNA Sequences and Disease
Let’s circle back to where we started—the connection between structure and function—and think about processes that could alter the structure, and therefore function, of proteins. As we have explored in several chapters and in the example above, the structure of proteins is due to its specific amino acid sequence, which is in turn coded for by the DNA sequence of the gene. Therefore, to change the structure of the protein, there needs to be a mutation, or change to the DNA sequence.
We can use our model of gene expression and knowledge of the steps to help make predictions about the effects of mutations. While not every change to the DNA sequence affects the amino acid sequence of the protein (can you use the genetic code table to give one reason why?), in some cases only a single base pair change to the amino acid sequence can dramatically affect protein structure and function.
Let’s look again at hemoglobin, which is a protein in your red blood cells that is essential for the transport of oxygen through your body. The hemoglobin protein has two alpha and two beta subunits (see Figure 6.7) that are encoded by two different genes. Mutations in the beta hemoglobin gene are associated with sickle cell anemia, in which red blood cells are abnormally shaped (sickle-like) and can block small blood vessels, leading to adverse health effects (sickle cell crises) if untreated. Figure 6.11 shows the relevant portion of the beta hemoglobin sequence. The typical beta globin gene sequence is referred to the A allele, and the S allele is the sequence associated with sickle cell anemia.

As you can see, there is only a single base pair difference between these alleles, which in turn changes just one amino acid in the beta hemoglobin subunit from Glu to Val. The R groups of these amino acids are shown in Figure 6.11. On your own, think about how you would classify these amino acids, then check your work using Figure 6.3.
Because these amino acid R groups have different chemical properties, they interact differently and form different 3D structures. The hemoglobin protein with the Val amino acid has an altered structure as compared to the A allele hemoglobin protein. This allows the hemoglobin proteins to abnormally clump together, causing the sickle cell phenotype of red blood cells.
a structure of DNA and proteins that functions as a unit of heredity
a repetitive sequence of DNA that plays a key role in cell division
