
Part 6: Spectroscopy
22 Infrared (IR) Spectroscopy
Radiation of lower energies causes less energetic transitions between energy levels. For example, infrared radiation is of the same order of energy as the vibrational energy levels of a molecule (which are also quantized); these are called vibrational transitions.
Infrared (IR) Spectroscopy
Infrared spectroscopy works similarly to UV-visible spectroscopy (in that it involves absorption of light) but provides different information about the sample. Electromagnetic radiation in the infrared range corresponds to the energy of molecular vibrations. Vibrational energy levels are quantized just as electronic energy levels are. It is possible to measure the absorption of the IR radiation as it causes the molecule to change from one vibrational energy level to another.

A typical IR spectrum appears to be quite complicated, and a great deal of information can be obtained about the structure of the compound under investigation. In organic chemistry, the IR spectrum is very useful because particular functional groups have very specific frequencies at which they absorb. For example, carbonyl groups typically show absorptions in the region between 1800 and 1620 cm-1. The units on a typical IR spectrum are expressed in wavenumbers (cm-1) which is the reciprocal of the wavelength of radiation absorbed.
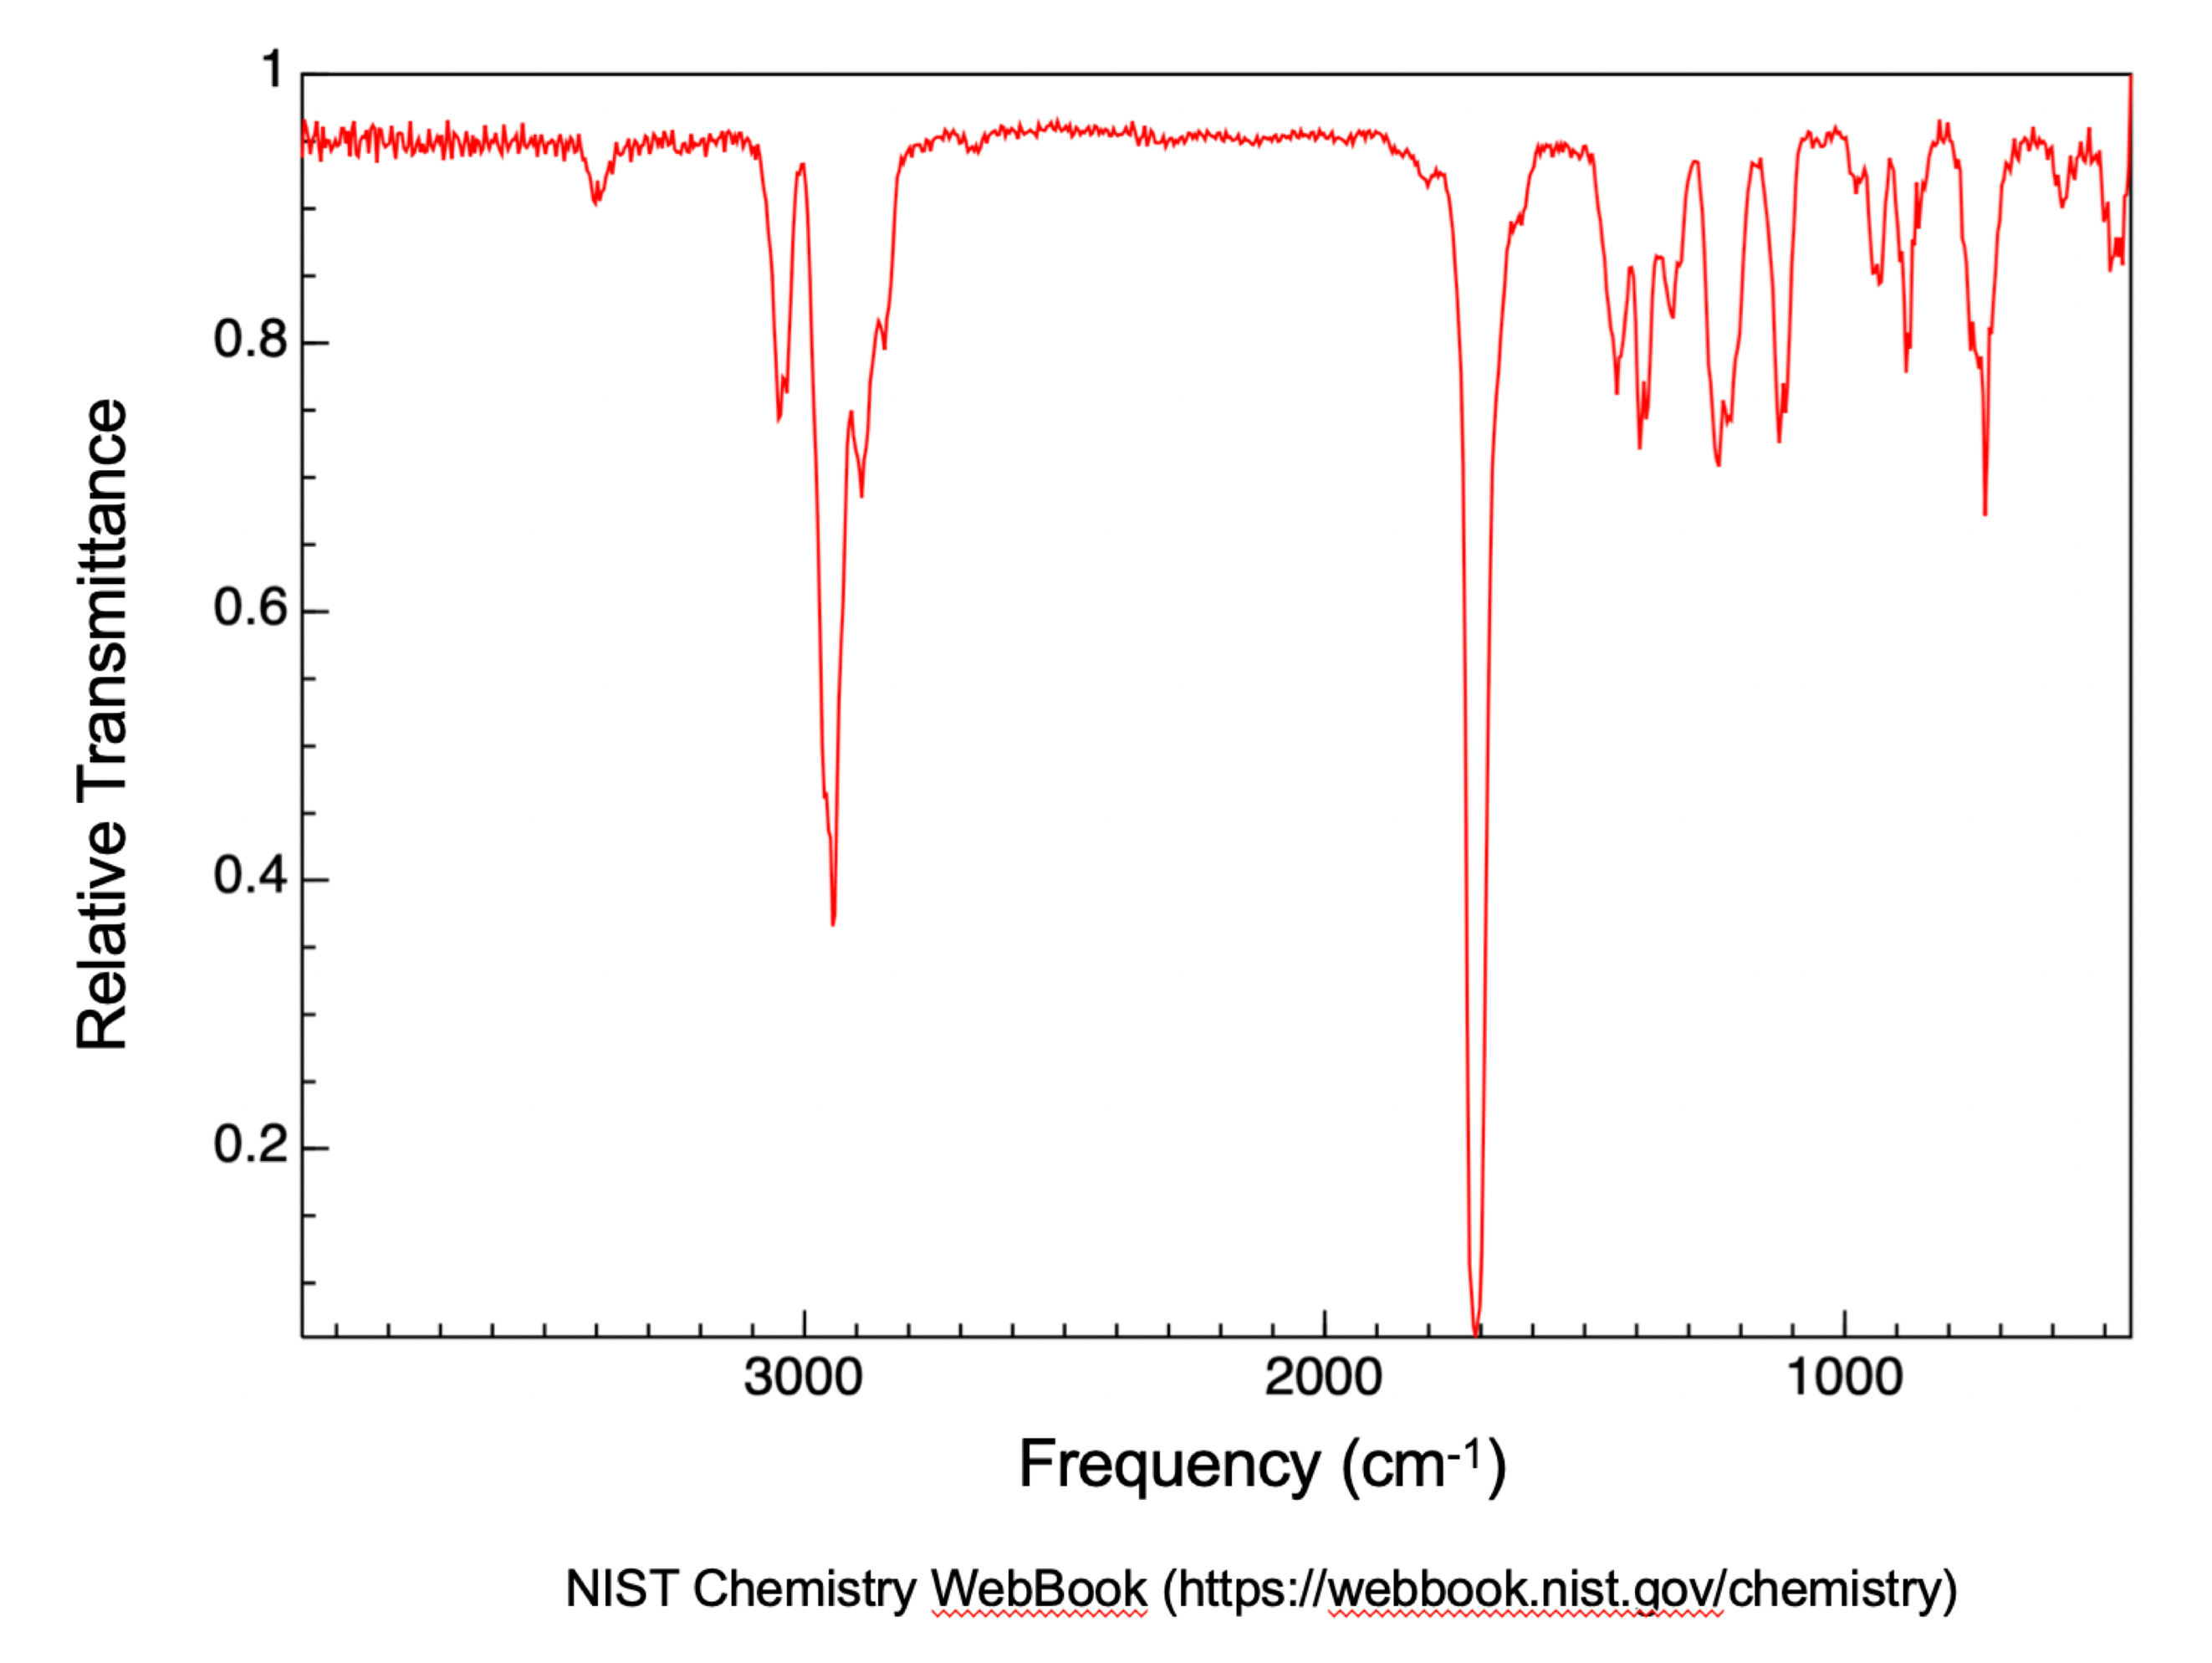
Figure 17 is a transmission IR spectrum of cyclohex-2-en-1-one (NIST WebBook). The most prominent feature is the strong absorption (i.e., little to no transmission) at about 1700 cm-1 which corresponds to the carbonyl (C=O) stretching frequency. You may also notice the peaks slightly above 3000 cm-1 to be sp2 hybridized carbon to hydrogen (Csp2-H) stretching, while peaks slightly below 3000 cm-1 to be sp3 hybridized carbon to hydrogen (Csp3-H) stretching.
The following table lists some common infrared spectroscopy absorptions by frequency regions.
| Peak Position (cm-1) | Group | Class | Peak Details |
|---|---|---|---|
| 3200-3550 | O-H stretching | alcohol | strong, broad |
| 3500-3350 | N-H stretching | amine | medium |
| 2500-3300 | O-H stretching | carboxylic acid | strong, broad |
| 2700-3200 | O-H stretching | alcohol | weak, broad |
| 3267-3333 | C-H stretching | alkyne | strong, sharp |
| 3000-3100 | Csp2-H stretching | alkene | medium |
| 2840-3000 | Csp3-H stretching | alkane | medium |
| 2222-2260 | C≡N stretching | nitrile | weak |
| 1818-1650 | C=O stretching | Carbonyl containing compounds | strong |
For a complete list of IR spectroscopy absorptions, see Infrared Spectroscopy Absorption Table.
Collecting an IR Spectrum
The Organic Chemistry Labs at MSU use commercial infrared spectrometers, which may be controlled via a graphical interface on a tablet computer. You should only operate the IR spectrometers after receiving proper training from your TA. However, you may find it helpful to familiarize yourself with the information here so that you can better follow along when it comes time to take IR spectra.
Application Startup and Spectrum Collection
The software has instruction screens built into it. The following instructions provide a detailed walkthrough and additional notes.
- Sprinkle some ethanol on a Kimwipe. Clean the round panel using Kimwipes and ethanol. Do not sprinkle ethanol directly onto the FTIR instrument.
- Start OMNIC Paradigm software on the instrument screen. Wait till the signal on the top right indicates “Nicolet Summit”.
- Click “Background” – wait for preview – click “Start Background Measurement”. This process may take 30 seconds.
- Load a SMALL amount of solid sample on the center of the round panel—twist the top detector part down until it is loosely in contact with the solid (do not push it too tight!). If your sample is a liquid, no need to twist the top detector down.
- Click “Measure Sample”. This process may take 30-60 seconds.
- Enter a name “sec 2 gr 2 pj 2 cat 4”, for example, for your sample – click “OK”.
- Select and unselect from the right graph list to only show your spectrum. Eye button enabled: show spectrum. Eye button disabled: hide spectrum.
- Click “File”→“Create Report”→“Create”→“Print”→Save pdf to your USB drive (inserted next to the screen). Eject the USB drive after the file was saved.
- Clean bottom panel and top detector with Kimiwipes and ethanol.
- Perform a simple analysis on the spectrum you collected. Ask your TA for assistance if you have any questions.
In conclusion, FTIR spectroscopy is a powerful analytical technique that provides valuable information about the chemical composition and structure of a wide range of materials. By understanding the principles behind FTIR and mastering the techniques involved, you will be able to analyze unknown samples, identify functional groups, and monitor chemical reactions with confidence.
Part of this chapter has been adapted from the CEM 161/162 manual: Cooper, M. M. et. al. Cooperative Chemistry for Michigan State General Chemistry Laboratories, 2019.
