
Part 6: Spectroscopy
23 Nuclear Magnetic Resonance (NMR)
As covered in class, one powerful tool for characterizing and confirming an analyte’s chemical structure is to take a nuclear magnetic resonance (NMR) spectrum. Unlike UV-Vis (which monitors the behavior of electrons) and infrared spectroscopy (which monitors the vibrational modes of the bonds within a molecule), this form of spectroscopy generates a signal (one or more sharp peaks) as a consequence of the spin of atomic nuclei. Using this characteristic, we can monitor how atomic nuclei of certain atoms (in this course, 1H and 13C) behave in a magnetic field (the spectrometer). For a refresher of the underlying theory and principles of NMR, see the OCLUE textbook (pages 44-56).
Spectrum Collection
The Nanalysis 60e (60 MHz) benchtop NMR spectrometer allows for routine screening of 1H/19F spectra with excellent performance. The following instructions provide a detailed walkthrough and additional notes:
NMR Sample Preparation:
- Weigh 0.03 – 0.05 g of solid power in a small beaker and dissolve in ~700 µmL chloroform-D solvent in the fume hood. Low-concentration solution will not yield good 1H NMR spectrum.
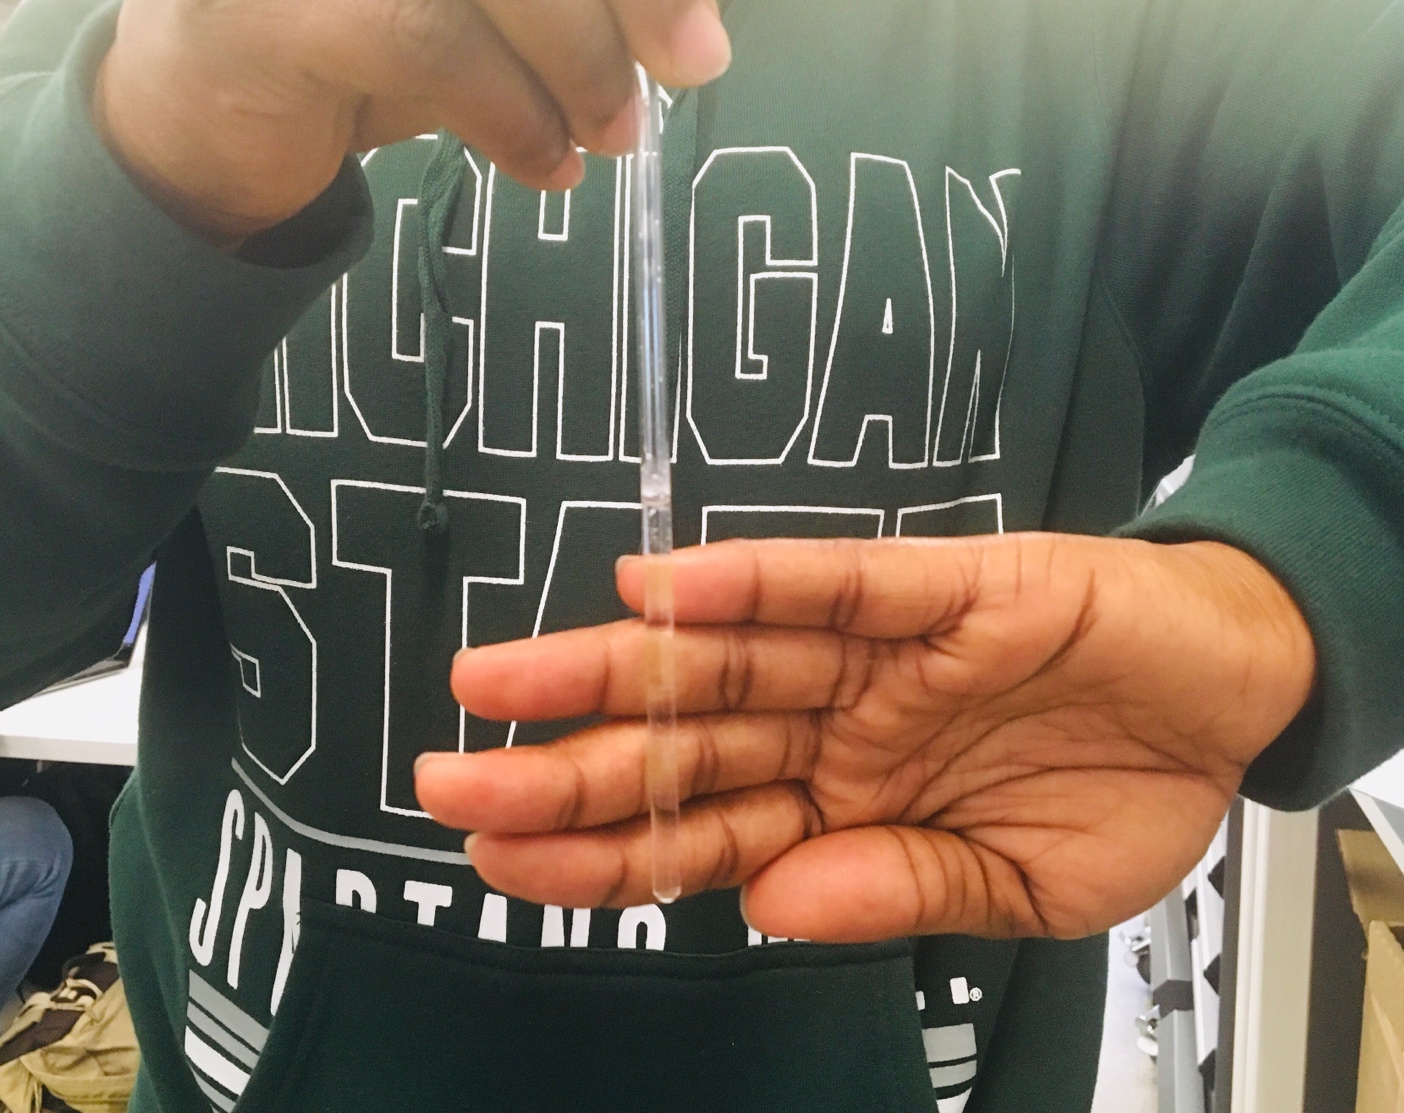
- Add the solution to NMR tube with extreme caution. NMR tubes are very fragile! Any insoluble precipitation or suspension cannot be transferred to the NMR tube.
- Here is a reference of how much needs to be added to the tube: between 3-4 fingers would be ideal. It is okay if it goes beyond the four-finger line, but it cannot be lower than the three-finger line.
- Cap the NMR tubes. Chloroform-D is a known carcinogen and health hazard, while being volatile.
- Put NMR tubes in the warmer next to the benchtop NMR for at least 5 minutes before the next step.
1H NMR Spectrum Collection
Note: this process must be supervised by a TA or course instructor. Report to your TA if you notice anything irregular.
- NMR will be on Standby mode as shown below while not running samples. There should be a blue sealed tube in the instrument for standby processing.
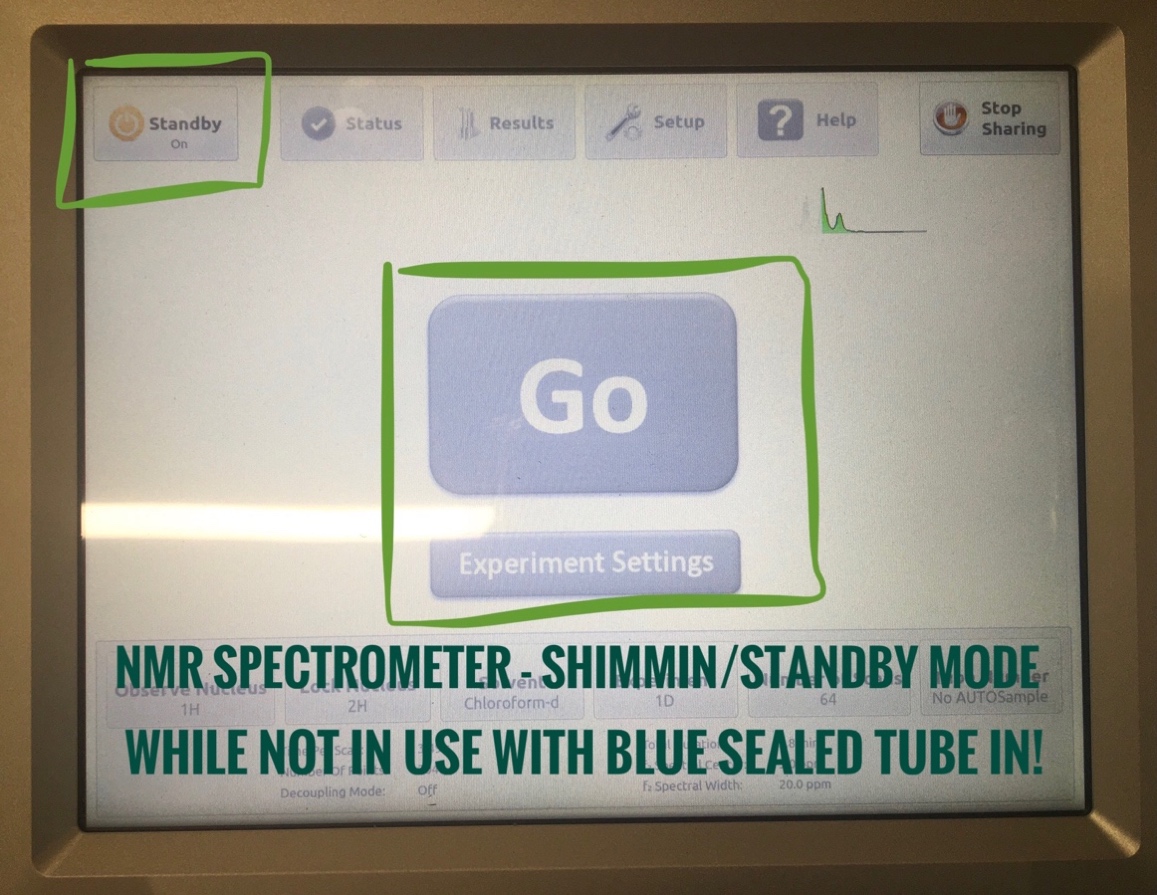
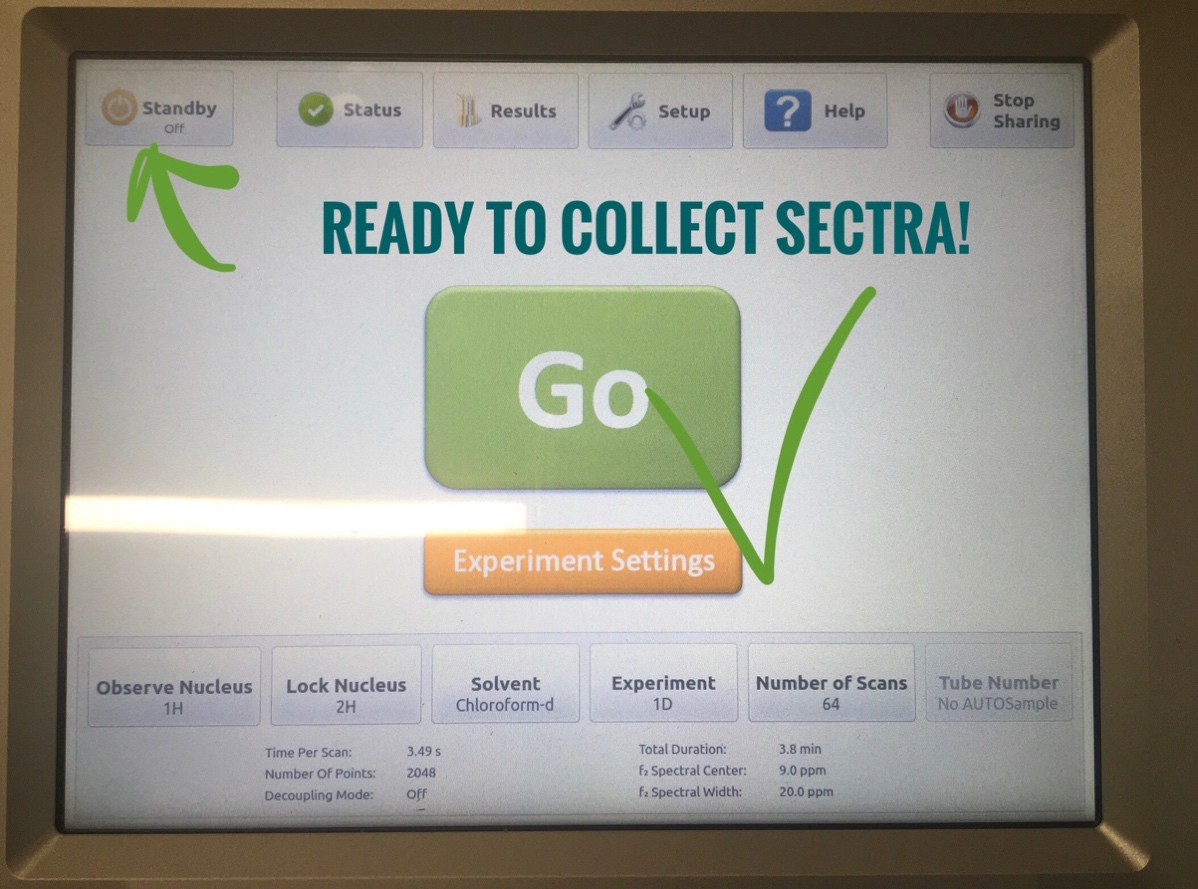
- Click on “Standby” orange button on the top left once. The “Go” button in the middle will turn green and be ready for sample collection!
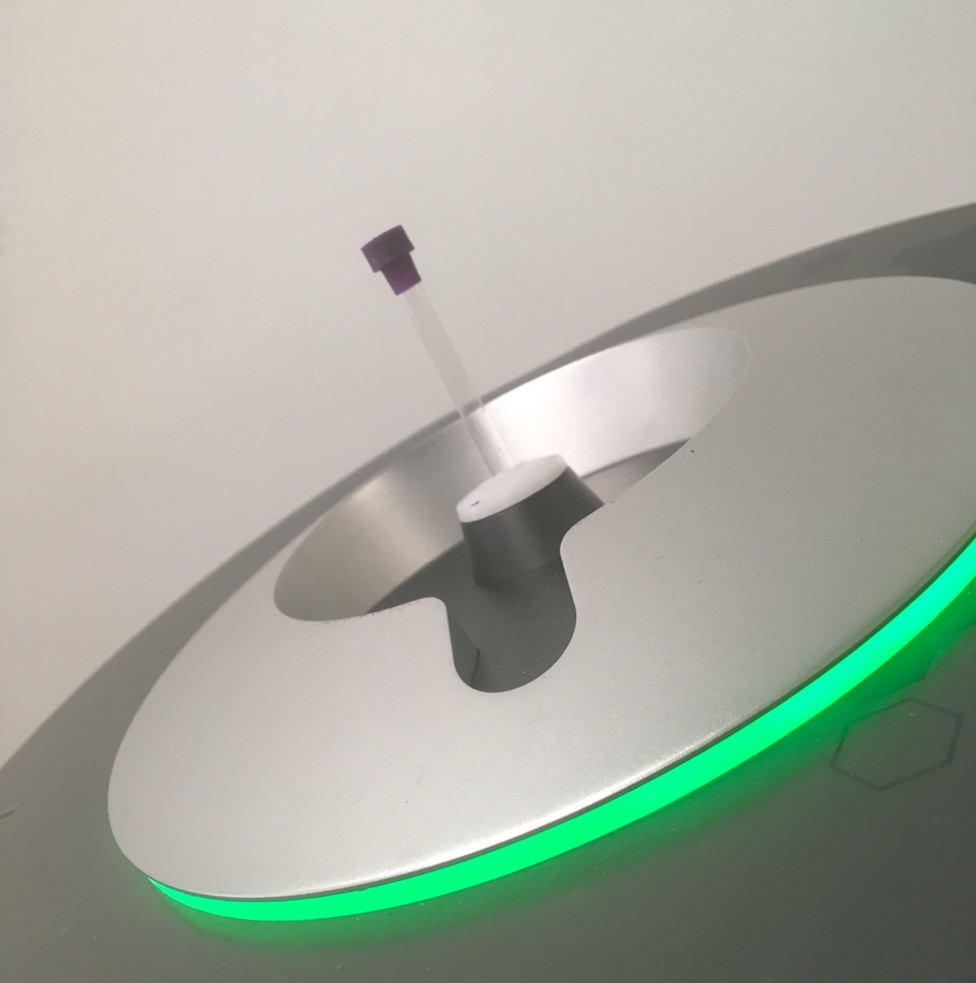
- Replace the blue-top sealed tube in the middle with your capped sample tube.
Careful: NMR tubes are pricy & fragile! Remove & insert with caution!
- Click the “Go” button on the screen, and you will see 1H NMR spectrum on the screen. Remember you required the instrument to collect 16 (or 64 scans), so it may take a while (3-5 minutes) to complete! After you see the “Done” button at the right bottom corner, the collection is complete! Don’t leave yet. You need to save your spectrum for integration next!
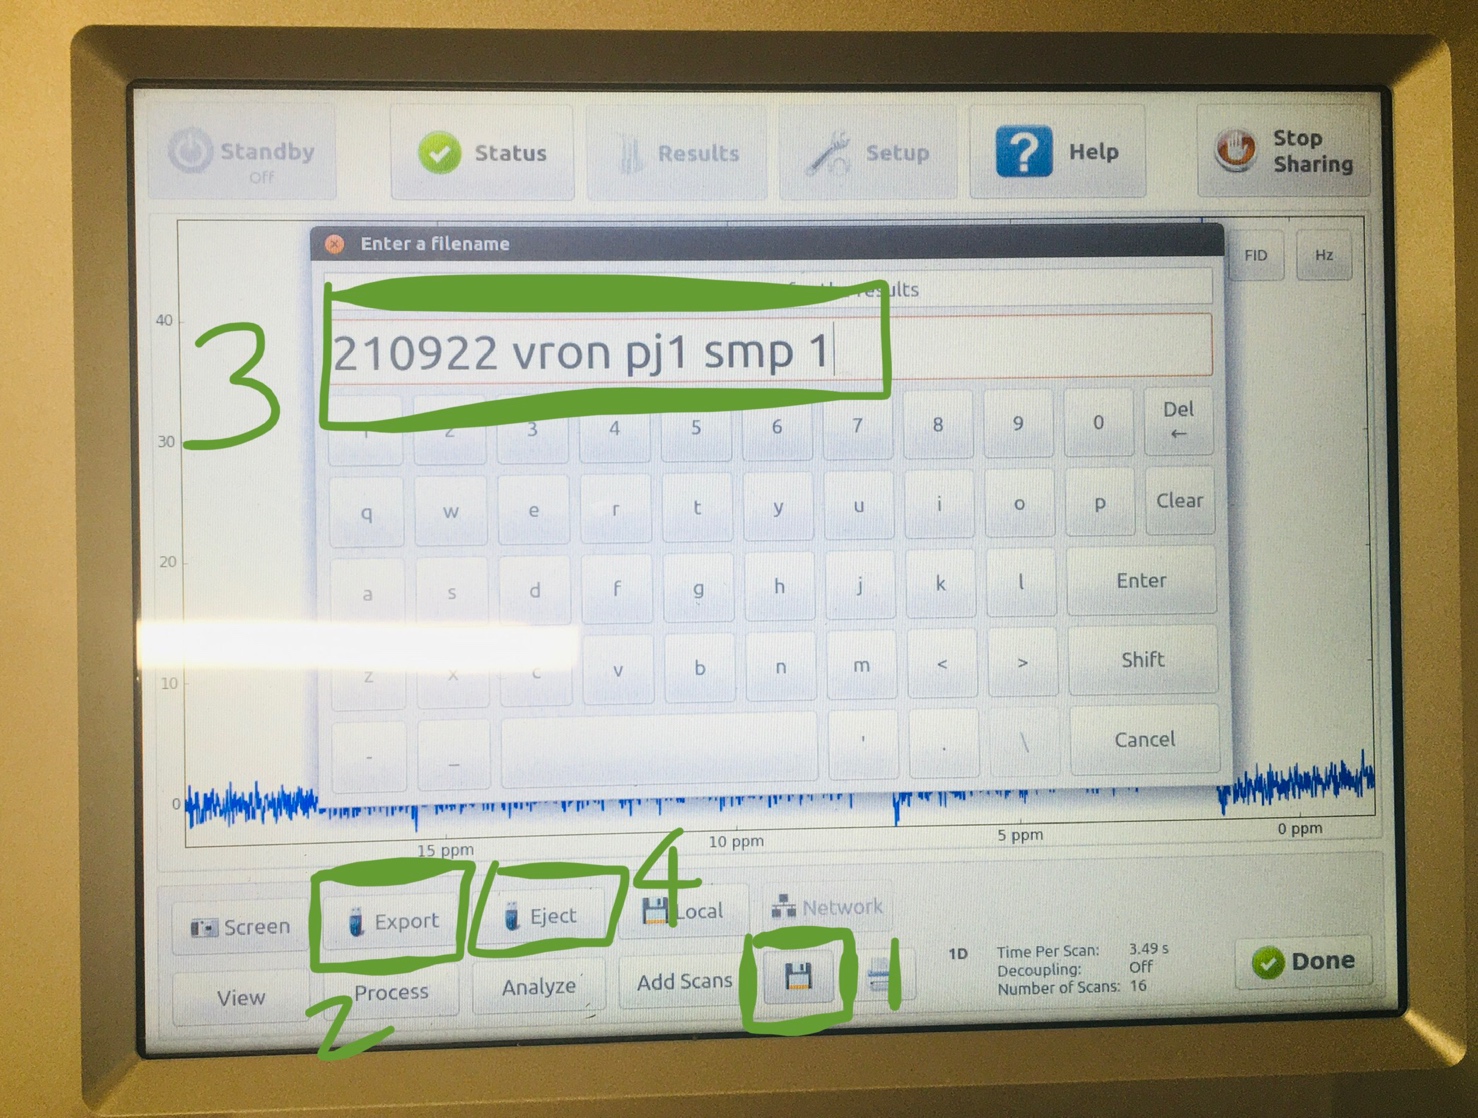
- Insert your flash drive (USB drive) in on the right bottom corner.
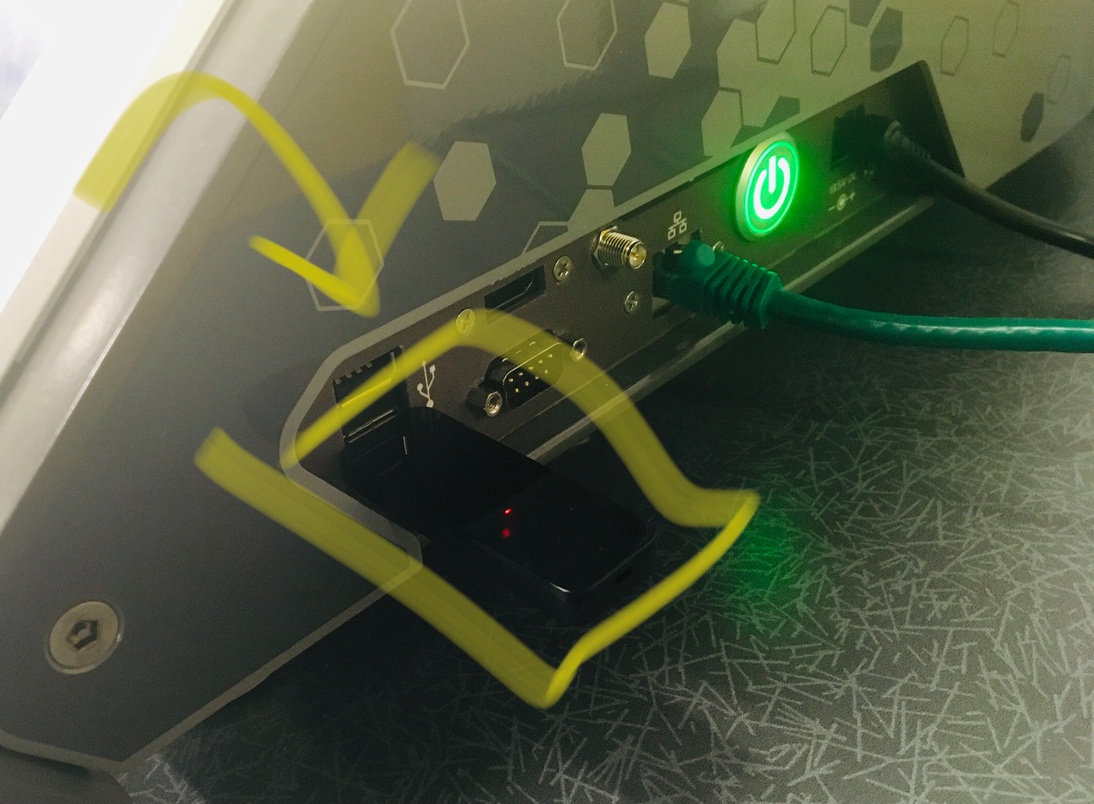
- Click on “save”. Select “Export” on the main screen. Save to a name you recognize. “Enter”, select “yes”. Click “Eject” (the flash drive) after spectrum is “saved”. Allow three seconds between every click to allow responding time for the instrument.
- Swap your sample NMR tube with the blue sealed reference tube in the NMR instrument.
- Click “Standby” again. If they asked for “insert blue tube” confirmation, select “yes”. The instrument will go back to shimming/standby mode again before you use it next time!
1H NMR Spectrum Integration & Analysis
- Insert your flash drive in the computer next to the NMR instrument. Open the “MestReNova x64” software on the desktop. Drag the dx file saved in your flash drive onto the opened MestReNova software.
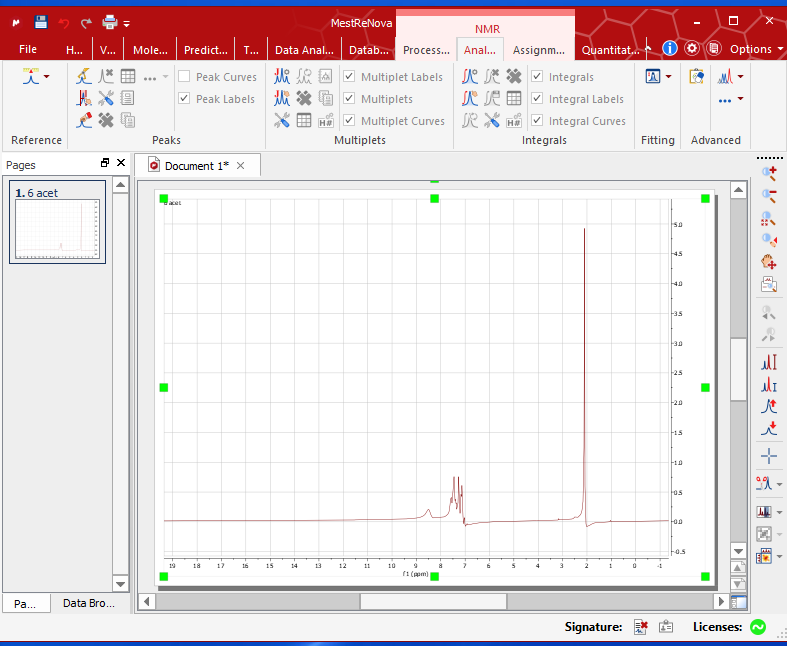
- Right click on the spectrum – Phase correction – Automatic.
- Right click on the spectrum – Baseline – Baseline correction – Yes.
- Right click – Zoom in – Drag to the area you want to focus on. Recommended range: 13 ppm – 0 ppm.
- [optional] Right click – peak pick – Automatic.
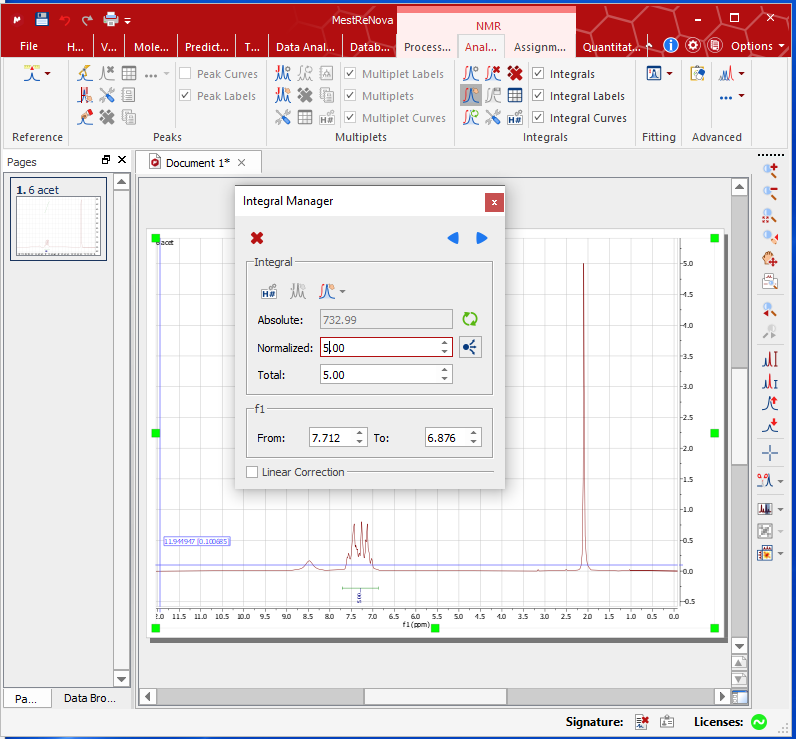
- Right click – Integration – Manual. Integrate all dominant peaks with your TA’s help. Do not integrate the solvent or impurities’ peaks.
- Select a peak range as reference – right click on the peak – edit – Normalize the peak to a predicted number.
- [optional] Right click on the spectrum – Properties – Grid – unselect show horizontal/vertical/frame – OK!
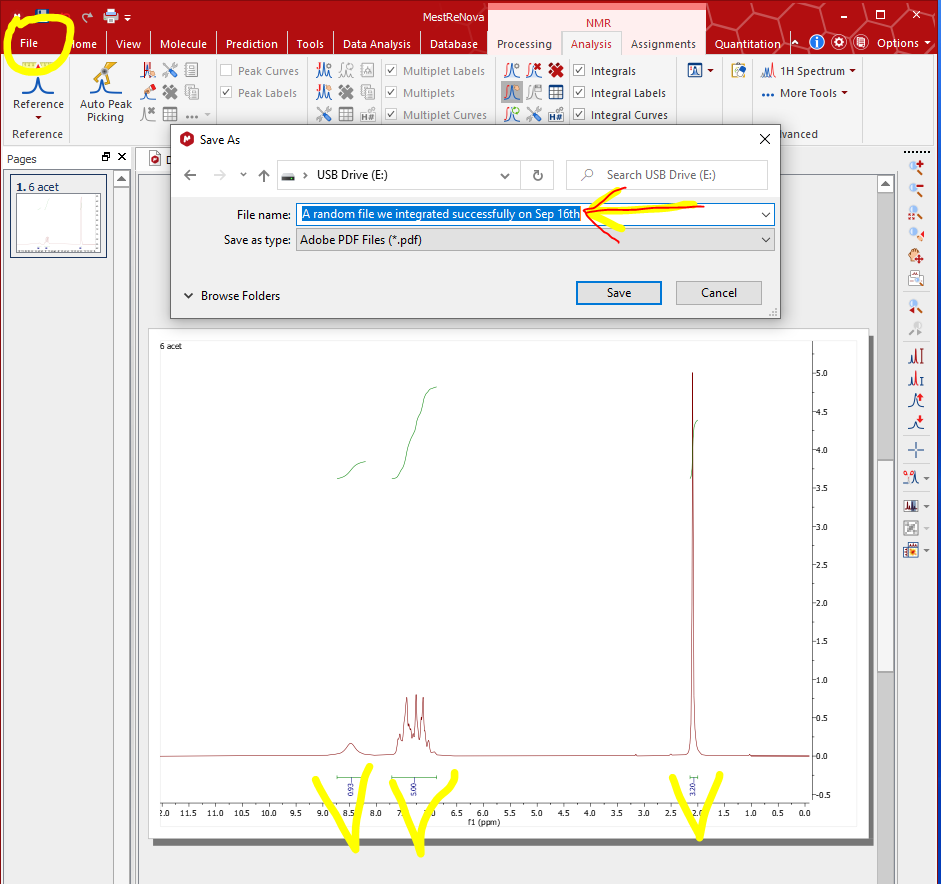
- File – Save As – Name the file and save as “Adobe PDF files” or “JPEG” as file type in your flash drive so that you can analyze on your laptops (Check with your TA if the integrated spectra is correct or not).
Note: The information on the spectrum is essential for identification! Analyze the spectrum collected from the following aspects:
- Integration: number of protons
- Chemical shift: chemical environment the protons are in
- Splitting pattern: “N+1” rule can help you predict the number of neighboring protons (N).
