
Part 5: Organic Laboratory Techniques
16 Characterization and Identification
Thin-Layer Chromatography (TLC)
Chromatography is a technique that is used to separate mixtures. To separate large quantities, you would perform column chromatography. For qualitative testing of small amounts (a few drops), you can use TLC. All chromatographic techniques share the same underlying principles.
One component is the stationary phase, composed of substances ranging from cellulose (in paper chromatography) to silica gel or alumina layered onto of a glass or plastic plate (in TLC) or finely powdered silica or alumina packed into a glass column (in column chromatography), to any number of complex mediums used in biological separations. The stationary phase is usually fairly polar and experiences strong attractive forces with polar analytes. The analytes to be separated become adsorbed (i.e., stuck) onto the stationary phase and stay there until dislodged by some external force.
Once the analyte has been adsorbed, the stationary phase is brought into contact with the mobile phase, usually a liquid, although in some instruments the mobile phase can be gaseous. The mobile phase is drawn along the stationary phase by capillary action; when the leading edge of the mobile phase (called the solvent front) reaches the adsorbed analyte, the analyte is preferentially attracted to either the stationary or mobile phase, depending on the polarity of the analyte. Although the common adage is that “like” solvents dissolve “like” solutes, most analytes (whether they are ionic or molecular in nature) experience some degree of attractive forces to both the stationary and mobile phases. An equilibrium is established for the analyte between the two phases, as shown in Equation 1.
[latex]D = \frac{[S_{\text{org}}]_{\text{total}}}{[S_{\text{aq}}]_{\text{total}}} = K_{\text{D}} = \frac{[S_{\text{org}}]}{[S_{\text{aq}}]}[/latex]
KD is the partition coefficient, while D is the distribution ratio. Sorg and Saq represent solubility of a compound in organic and aqueous phases. This equation can be used to calculate for liquid-liquid extraction with no secondary reactions.
As the solvent front moves up the stationary phase, developing solvent that is “fresh” passes over the spot of analyte, and new equilibria are established. At the same time, any of the analyte that has dissolved in the mobile phase encounters fresh stationary phase, and new equilibria are established. The total effect of all these equilibria is that the movement of the substance depends on the nature of its relative attractions with the substances of the mobile and stationary phases. We characterize this movement in terms of retention factor (Rf), defined in Equation 2.
[latex]R_f = \frac{\text{distance traveled by spot}}{\text{distance traveled by solvent}}[/latex]
Rf values can be as high as 1.0 if the analyte moves with the solvent front and as low as 0 if the substance does not move at all. The Rf values are reproducible for a particular analyte and solvent system if the experimental conditions are closely controlled. One important variable is the composition of the developing solvent (the mobile phase). If one of the solvent components is volatile (has a low boiling point), it is possible that evaporation will change the percent composition of the solvent as you develop the chromatogram. You can avoid this complication by developing the chromatogram within a closed container so the air inside the container is saturated with solvent vapor.
A sample containing two or more components can be separated (or resolved) by choosing a solvent system for which the sample components have distinctly different Rf values.
Procedure for TLC:
- Prepare a developing chamber (beaker with watch glass as cover can be used) by placing about 0.5 cm depth of your chosen solvent system. It is recommended to line the beaker with filter paper or a paper towel, which will allow the vapor and liquid to equilibrate faster. In order to have reproducible TLC results, you need to have the solvent tank saturated with the vapor of the developing solvent(s). Let the solvent equilibrate for 5-10 minutes.
- Obtain a piece of chromatography paper or a TLC plate. If you use paper, you can fold it in half lengthwise so it will stand up in the tank. Draw a line lightly with pencil 1 cm from the bottom of the paper. If the starting line fell below solvents, sample dots will dissolve in solvents rather than eluting up the plate at designated spot.
- Make a dilute solution of the analytes of interest and place spots of each solution on the pencil line. For instance, a capillary tube can be used as a TLC spotter. You can place spots from several analytes (or standards, if you are running a comparison) on this line, as shown in Figure 11.
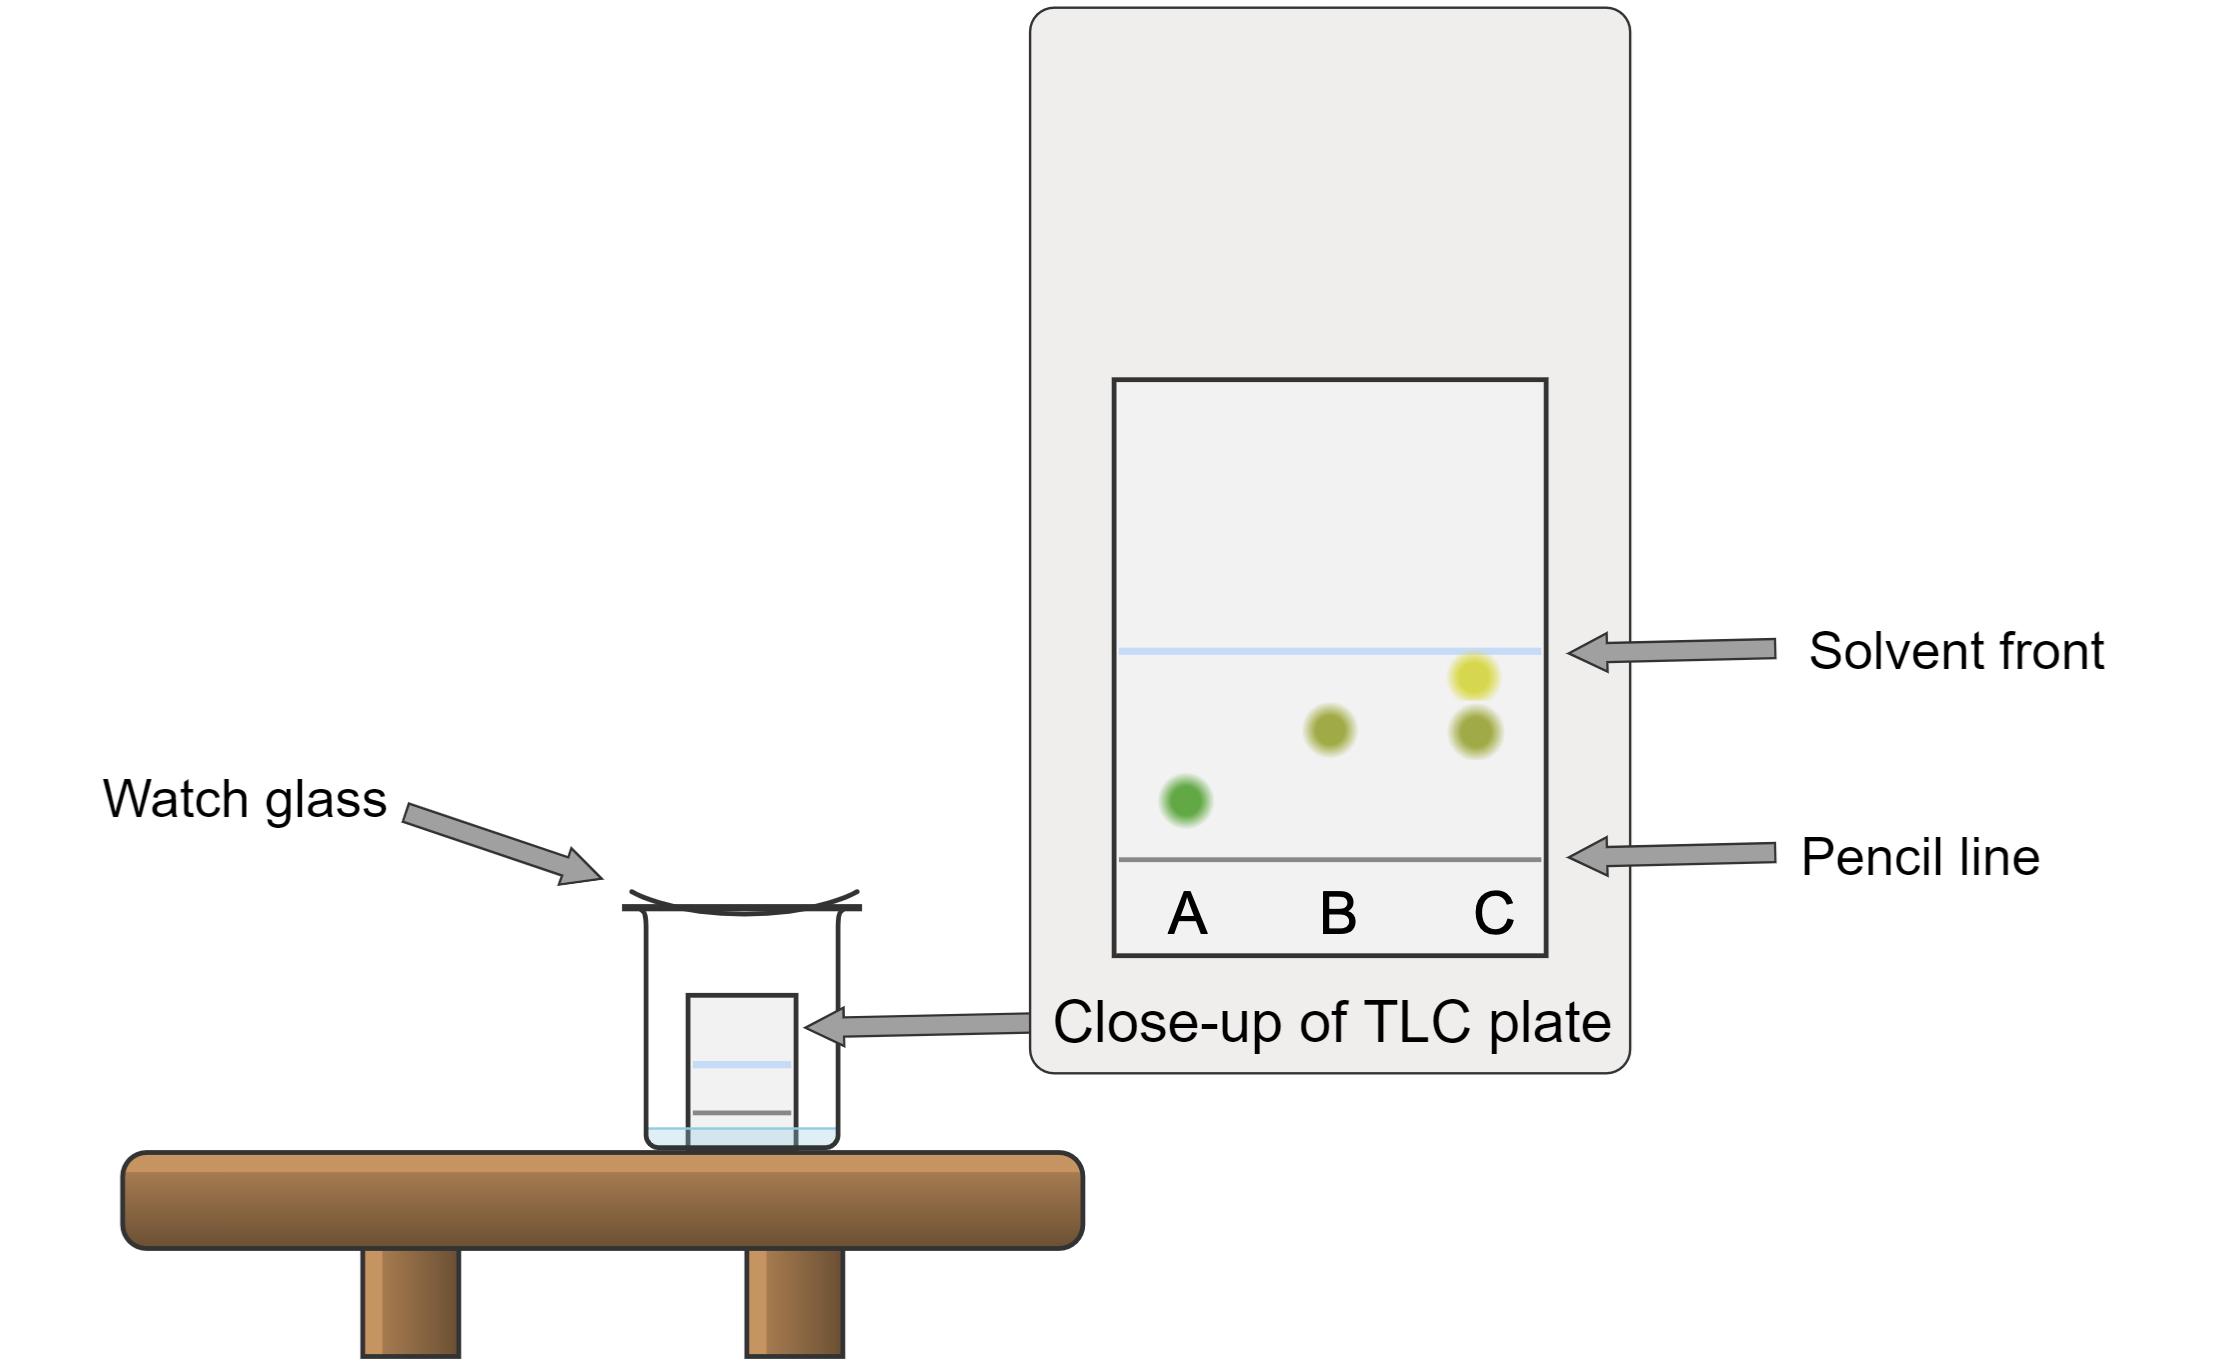
Note: The spot must be small; otherwise, the stationary phase will be overloaded, and the plate will be smeared. The best way to establish this is by trial-and-error. The pencil line must be above the solvent level in the TLC developing chamber. Use the UV lamp to do a preliminary check to see if you have any compound on the plate.
On the plate shown in Figure 11, three samples are spotted. Sample A (green dot) might be a reaction mixture, and sample B (hazel dot) might be a dilute solution of two starting materials. Sample C contains unreacted sample B and a new compound (indicated by a yellow dot) but showed no presence of sample A. The dots shall be sufficiently spaced apart for better separation and identification.
- Place the chromatography plate in the developing chamber, cover the chamber, and allow the solvent to rise up until it is about 1 cm from the top of the paper.
- Remove the paper and mark the level where the solvent has reached with a pencil. In your lab notebook, draw a picture of the resulting separation if spots are visible and note the solvent system used. If nothing is visible on the plate, several methods can be used to visualize the spots. An iodine chamber will make most organic species appear as brown spots. There are a number of specialized visualizing agents that can be sprayed on the plate and heated. If the TLC plates have a fluorescent indicator in them, a UV lamp can be used and the plates will glow under the light, causing the spots to appear dark where they cover the fluorescent indicator. If you use a UV lamp, be sure not to look directly into the light. Your TA will help you determine the most appropriate method for your needs.
- Calculate the Rf of each spot as shown in Equation 2, reproduced below.
[latex]R_f = \frac{\text{distance traveled by spot}}{\text{distance traveled by solvent}}[/latex]
- Repeat the process with another solvent, and note the difference in the Rf values of the spots.
- Repeat the process until you find the appropriate solvent.
TLC is a versatile and widely used technique in organic chemistry laboratories for identification of chemicals. TLC is particularly useful for monitoring reaction progress and completion. As a reaction progresses, the composition of the reaction mixture changes, leading to changes in the spots observed on the TLC plate. By comparing the spots from the reaction mixture to those of the starting materials and products, one can assess the extent of the reaction and the formation of intermediate products or byproducts.
TLC technique also has its limitations. It is not a quantitative tool and does not allow for the isolation of mixtures. TLC may not be able to separate compounds with similar size, structure, and polarity. Additionally, not all chemicals’ spots show up under UV lamp, and some compounds may not be suitable for analysis by TLC due to their chemical properties or interactions with the stationary phase or mobile phase. Furthermore, TLC may not be as sensitive as other analytical techniques, such as mass spectrometry or UV-visible spectroscopy, which can limit its ability to detect low concentrations of compounds.
Remember to always follow safety precautions and proper procedures when handling chemicals and equipment.
Note: Part of this chapter has been adapted from the CEM 161/162 manual: Cooper, M. M. et. al. Cooperative Chemistry for Michigan State General Chemistry Laboratories, 2019.
