
4 Gene Expression 1: Using DNA to Produce RNA
Learning Objectives
- Describe the outcome of gene expression and how this relates to cell function
- Interpret experimental evidence that identified DNA as the genetic material
- Describe key features of DNA structure and RNA structure important for the storage and transfer of genetic information
- Use a model to describe the process of transcription
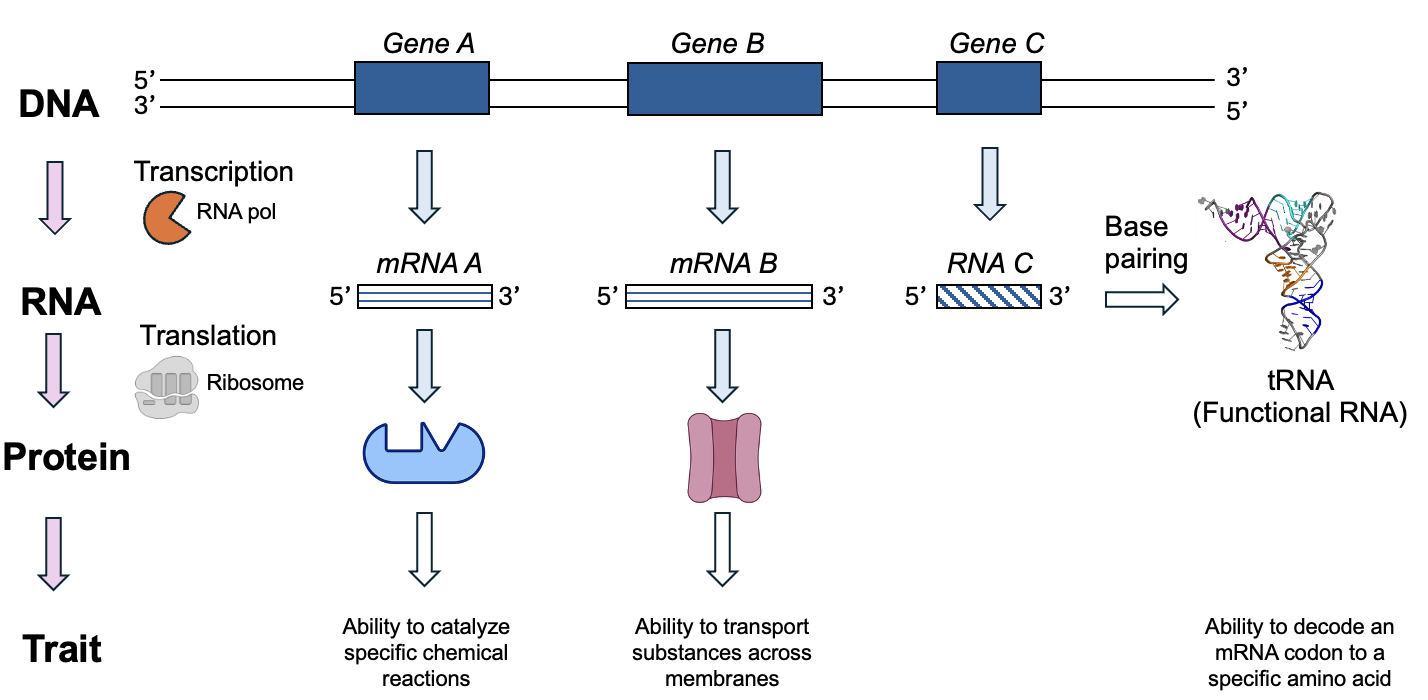
In Chapter 3, we learned about the different macromolecules found in cells. But where do these macromolecules come from? Every macromolecule is formed using chemical reactions that create new covalent bonds, and those reactions almost always require a type of protein called an enzyme and energy input to create more complex molecules (more information on enzymes and energy will come in later chapters!). Thus, we first need to learn how proteins are made. From chapter 1, we know that in the process of gene expression, the information in DNA is used to make RNA, and for certain RNAs, the information in the RNA molecule is used to make proteins. Those proteins in turn give living organisms their traits—their structures, ability to catalyze reactions, and to carry out other functions. Importantly, when things go wrong, the culprit is often a difference in the DNA sequence that changes a protein’s structure and function, thus altering a trait.
In the next two chapters, we will focus on how the gene expression process works, first focusing on the production of RNA. In later chapters, we will come back to this information to understand how errors and changes in gene expression affect protein structure and function. These steps that we will be learning about over the next few chapters are summarized in Figure 4.1.
Additionally, you may wish to watch this short video that gives a general overview of the process and the molecules involved.
Chapter Outline
Section 4.1 DNA as the Genetic Material
Section 4.2 Key Features of DNA Structure
Section 4.3 Key Molecules in Transcription
Section 4.4 Process of Transcription
Section 4.5 Cellular Location of Transcription
Section 4.1 DNA as the Genetic Material
DNA is the genetic material of cells, and therefore a universal feature of cells, and is the starting molecule for most gene expression in cells. But how did we figure this out? The general concept of heredity, that certain characteristics passed from parents to their offspring, was well accepted before anyone had identified the molecules in the cell responsible for this process, or how this process worked. However, in the early 20th century, scientists had clear expectations for the biological material of heredity:
- The material should be present in all cells.
- The material should contain useful information for the cell.
- The material should be different in different species, since different organisms look different and carry out different functions.
- The material should be relatively stable, with some limited ability to change.
- The material should be able to be replicated and passed on to future generations.
The Transforming Principle
Significant progress in identifying the molecule of heredity came from a series of experiments with an entirely different aim, to produce a vaccine against pneumonia. In the early 1900s, two types of pneumonia-causing bacteria were identified. These two strains, or subtypes of pneumococcus bacteria differ in two key traits, or phenotypes. The S strain, so-called because of the “smooth” appearance of its colonies in culture, was also virulent: if injected into mice, it caused an infection, and the mice died of pneumonia. The physical appearance of the bacteria and the effect on mice are both phenotypes. However, the R strain, which had a “rough” appearance in culture, did not cause an infection, and thus this strain has a nonvirulent phenotype. In a study published in 1928, the pathologist Frederick Griffith showed that the S strain could be made non-virulent if heated to 60°C to kill the bacteria—when mice were injected with heat-killed S strain bacteria, they also survived. Strikingly, however, when heat-killed S strain bacteria (nonvirulent) were combined with living R strain bacteria (nonvirulent) before injection into mice, the mice died. Moreover, the living bacteria recovered from the dead mice resembled S strain bacteria. Griffith suggested that some substance from the killed S strain bacteria was able to change, or transform, the characteristics of the R strain bacteria, turned them into S strain bacteria. The results of these experiments are summarized in Table 4.1.
| Experiment | Result |
| Mice injected with live S strain cells | Mice die of pneumonia |
| Mice injected with live R strain cells | Mice live |
| Mice injected with heat-killed S strain cells | Mice live |
| Mice injected with heat-killed S strain cells and live R strain cells | Mice die of pneumonia |
So, what is this mysterious substance? From Chapter 3, you know what types of molecules are present in cells, so what approach would you take to figure out which molecule or molecules are responsible for changing the phenotype of the bacteria? Oswald Avery and colleagues took on this challenge, using chemical methods to isolate a substance from S strain bacteria with this transforming ability, which they called the ‘transforming principle’ in their 1944 publication. This material had a chemical composition nearly identical to purified DNA. Moreover, when the substance was treated with enzymes that would destroy DNA, RNA, or proteins, they found that degrading the RNA or the protein did not disrupt the ability of the substance to transform bacteria. Only the enzyme that destroyed the DNA caused a loss of transforming ability. The results of the enzyme experiments are summarized in Table 4.2.
| Enzyme treatment | Macromolecules destroyed | Macromolecules remaining | Transforming ability? |
| Protease | Protein | DNA & RNA | Yes |
| RNase | RNA | DNA & protein | Yes |
| DNase | DNA | RNA & protein | No |
Section 4.2 Key Features of DNA Structure
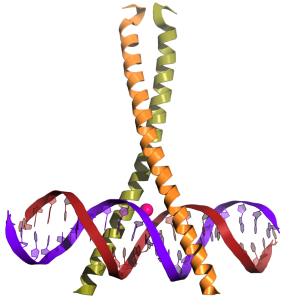
The experiments described above and others that followed clearly identified DNA as the genetic material. Going back to the list of expected characteristics of genetic material, some features were met based on understanding of DNA at that time. All cells appeared to contain DNA, and different organisms had somewhat different amounts of the different nucleotide components of DNA, appearing to support items 1 and 3 from the list. However, it was completely unknown how DNA encoded information and how it could be replicated into order to pass that information to later generations. Given that the structure of molecules supports its function, attention shifted to uncovering the structure of DNA. In 1953, James Watson and Francis Crick published their model of DNA, showing it to be a double helix. As with all models, this model synthesized the findings of many scientists while also providing the basis for several predictions about how DNA stores and transmits information.
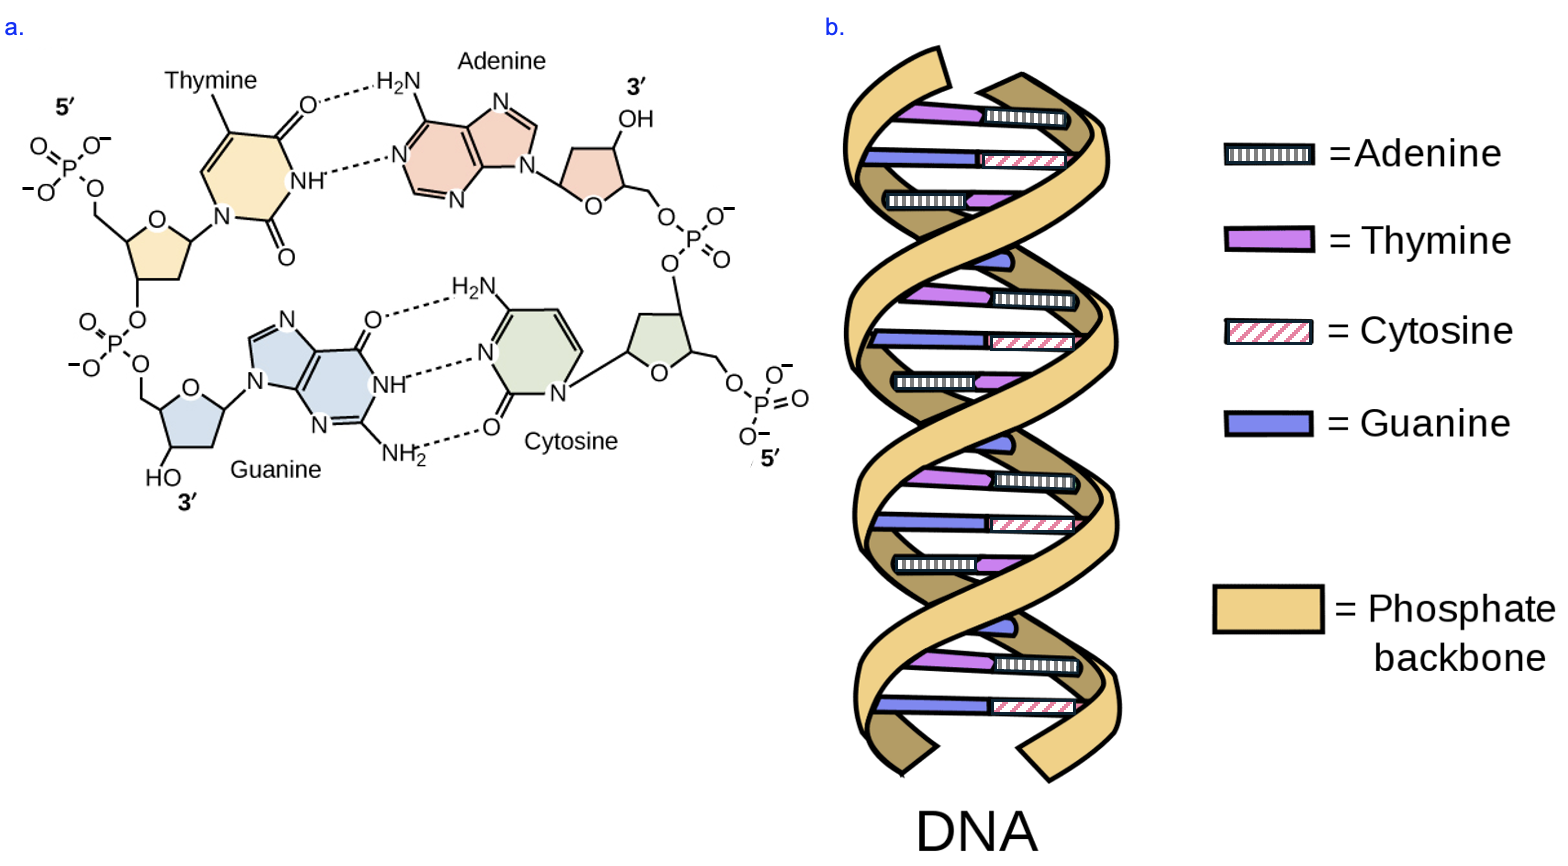
Let’s recap some key points about DNA structure we explored in Chapter 3. DNA is a nucleic acid made up of nucleotides, and every DNA nucleotide has a phosphate group, a deoxyribose sugar, and a nitrogenous base (Figure 4.2). The phosphate and sugar group are the same from one DNA nucleotide to the next, while the base can be one of four types: adenine (A), guanine (G), cytosine (C), or thymine (T). Each strand of DNA is a chain of these nucleotides, connected by covalent phosphodiester linkages between the sugar of one nucleotide and the phosphate of the next nucleotide. Between the two strands of the double helix, the bases interact through hydrogen bonding, forming specific, complementary base pairs (A with T, G with C). When these specific bases pair, the way in which the bases hydrogen bond produces a double helix in which the width is the same up and down the length of the structure (Figure 4.2b). Any other pairing would result in a helix that is wider or narrower. Lastly, recall that the phosphate group of the nucleotide is attached to the 5’ carbon on the sugar, while the 3’ carbon of the sugar is either a free hydroxyl group or attached to the next phosphate in the chain. The free phosphate at the end of each strand indicates the 5’ end of the strand, and free hydroxyl on the other end is the 3’ end. Notice that the 5’ end of one strand pairs with the 3’ end of the other strand in the double helix—this antiparallel orientation of strands is always true of nucleic acids that base pair.
Given that the structure of DNA must encode information, and that the only part of the structure that varies along the strand is the nitrogenous base, we can deduce that the specific sequence of bases is the genetic information. Further, given the specific base pairing rules, if you knew the sequence of a strand of DNA, you (or an enzyme in the cell) could use those same rules to determine the sequence that would base pair with that DNA strand. Thus, the structure of DNA allowed for predictions of how DNA could transmit information: one DNA strand could serve as the template for producing another DNA strand or an RNA strand (as we will see shortly, the rules for pairing RNA with DNA are like the rules for pairing two DNA strands, with one significant exception).
This brings us back to the central dogma, which describes the flow of genetic information in the cell from DNA to RNA to protein. In the first step, information in one type of macromolecule, DNA, is used to make a related macromolecule, RNA. Base pairing between DNA and RNA strands is key to transferring that information from DNA to RNA, which are both nucleic acids. Then in the process of translation, the information in the mRNA and the language of nucleic acids is used to make a protein which is made up of amino acid, a completely different language, to make a completely different macromolecule.
Section 4.3 Key Molecules in Transcription
As mentioned previously, the process of transcription uses information from DNA to produce an RNA sequence. Moreover, the creation of any macromolecule requires an enzyme to create the covalent bonds between monomers. Therefore, at minimum, transcription requires a DNA template strand, RNA nucleotides (monomer building blocks), and an enzyme to synthesize the phosphodiester linkages between monomers to create the macromolecule. The enzyme that performs this task is aptly named RNA polymerase, as it creates a polymer of RNA. RNA polymerase is a large complex with several components, or subunits, but for simplicity, we will just refer to it as a single entity, RNA polymerase, sometimes abbreviated RNA pol.
Comparing DNA and RNA
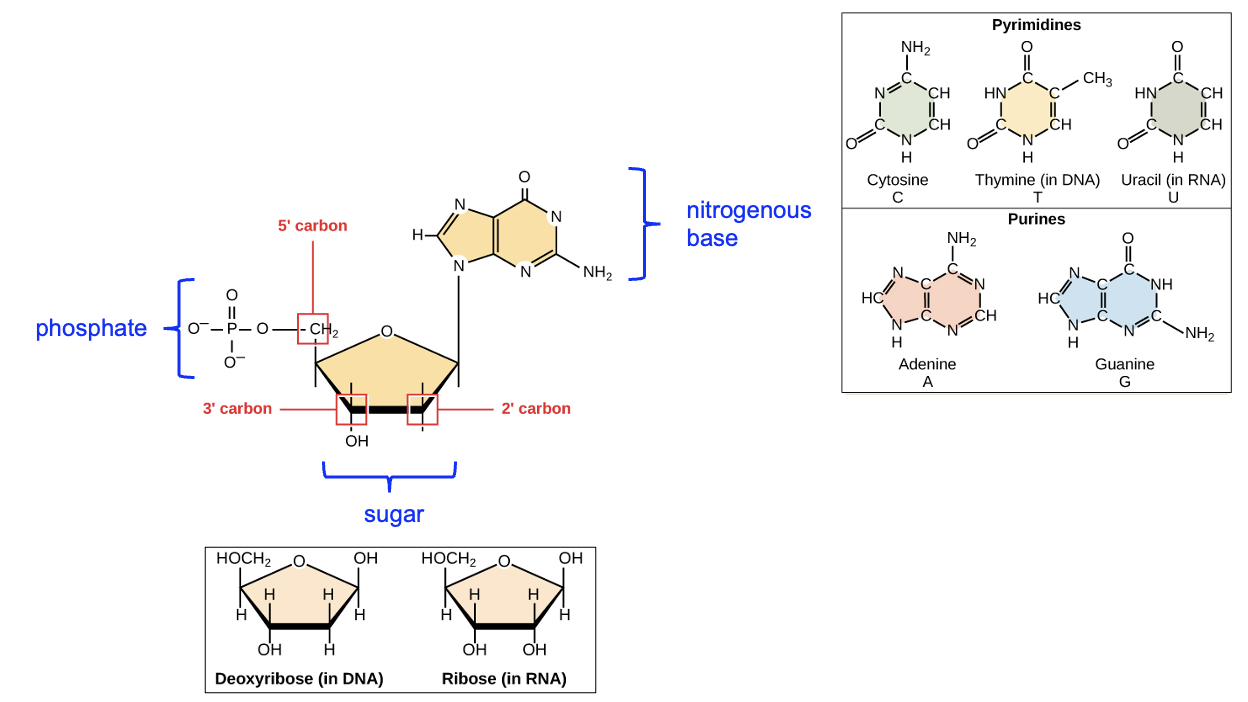
In the prior section, we recapped the key features of DNA. Now, let’s discuss key differences between DNA and RNA. In terms of the nucleotide monomers, RNA nucleotides differ from those used to build DNA in two aspects. First, the sugar is different: DNA nucleotides have a deoxyribose sugar, whereas RNA nucleotides have a ribose sugar. This difference is apparent if you look at the 2’ carbon on the sugar, which has OH attached in the RNA nucleotide, but only H attached in the DNA nucleotide. The second difference is in the nitrogenous bases that are present in RNA vs DNA. While both DNA and RNA contain A, C, and G bases, only DNA contains T and only RNA contains U (Figure 4.3).
DNA and RNA also differ in their structure in the cell and relative size. While DNA is almost always double-stranded, RNA is typically single-stranded. Additionally, while DNA molecules can be quite long (often millions to hundreds of millions of base pairs in length), RNA molecules are considerably shorter (hundreds to thousands of nucleotides in length). Both features of RNA arise due to the process of transcription. Only one of the two DNA strands is used as a template for transcription, so the RNA is produced using the sequence of that template strand. Moreover, only a small subset of all the DNA in the cell, or its genome, is transcribed at any given time. All the DNA in a cell constitutes the cell’s genome, and this genome contains all the instructions needed to produce the functions of that cell. In some ways, the cell uses the genome like you might use this textbook—only reading the portions that are relevant at any given time. For example, to prepare for a class day on transcription, you might only read this chapter as opposed to the entire book. Likewise, when a cell needs to create a particular protein, it goes to the specific segment of DNA containing the information to make that protein and carries out the gene expression process. Also, just as your reading this chapter of the textbook doesn’t alter the content of this chapter in any way, when a cell uses a DNA sequence as a template in transcription, the transcription process does not alter the DNA sequence. This is important, as it allows the cell to repeatedly access the same information in the DNA sequence, every time the cell needs to make the same protein.
Gene Promoters and Terminators
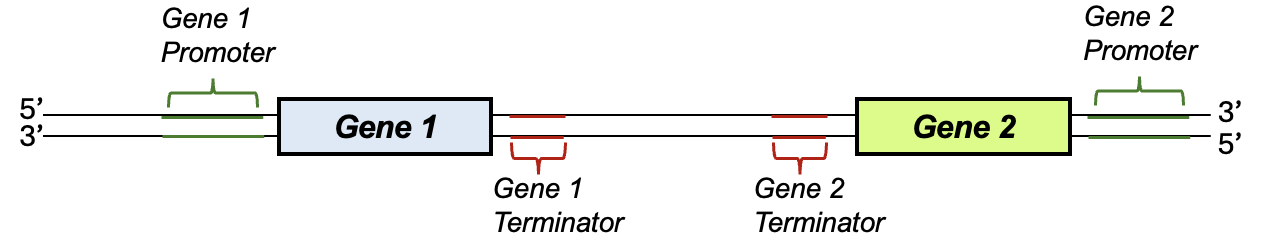
How does the cell go about identifying which segment of the genome to transcribe? Consider that the human genome is 3 billion base pairs (also, each of your cells has two copies of the genome, so that’s 6 billion base pairs per cell!). Of that, less than 2% of the human genome is thought to code for proteins, which means that finding the small fraction of the genome where a gene is located is a real challenge. To assist RNA polymerase, there are both cues in the DNA sequence itself and specific proteins that assist in bringing RNA polymerase to the correct sequence to start transcription. Figure 4.4 is a schematic of a DNA segment that contains two genes. In this model, lines indicate DNA strands, while other important elements are labeled with brackets or boxes. For gene expression to occur, the cell needs a sequence to indicate where transcription should begin and end. These are indicated on the schematic as promoter and the terminator sequences, respectively, and notice that these elements flank the sequences to be transcribed. We will focus most of our attention on promoters. Interestingly, the composition of promoters can vary widely from gene to gene and across species. Thus, we will often just refer to these as generally as “promoter sequences” rather than giving specific sequences.
Before going on the describe promoters in more detail, please note that we will use many different models of DNA and RNA throughout this book. As noted, Figure 4.4 represents a DNA sequence even though it lacks the other chemical details we have seen in other images. Figure 4.5a shows a different common representation of a DNA sequence. We can recognize this as DNA because there are two strands marked with 5’ and 3’ ends, these strands are complementary and antiparallel to each other, and there are Ts but not Us in the sequences. This figure represents the phosphate-sugar backbone with lines, and the nitrogenous bases with the letters only. In both of these figures and others like this, the relevant bonds and interactions in DNA that were discussed in the prior section on DNA structure are present and relevant, even though they aren’t drawn in chemical detail or labeled. On your own, note where phosphodiester linkages would be found in this model. What about hydrogen bonds?
In gene expression the purpose of a promoter sequence is to attract RNA polymerase to the beginning of the gene, and to indicate the direction of transcription, so the gene can be correctly expressed. In Figure 4.5a, notice the bent arrow and +1 that indicate (1) the specific start of transcription, and (2) that transcription occurs from left to right relative to this model. In this hypothetical case, transcription starts a few base pairs after the promoter sequence. In practice, the transcriptional start site is experimentally determined by comparing RNA sequences with DNA sequences, and can vary. The direction of transcription shown in Figure 4.5a, with the bottom DNA strand serving as the template, corresponds with Gene 1 in Figure 4.4. However, Gene 2 in Figure 4.4 has the opposite arrangement of promoter, gene, and terminator. Thus, the top strand is the template for the transcription of Gene 2.
To attract RNA polymerase to the promoter sequence, a group of proteins called positive transcription factors are typically involved. These proteins have the shape and chemical properties to fit into the grooves of the double helix of specific DNA sequences (Figure 4.6 shows a model of this interaction). The specific amino acids in the transcription factor then interact with specific atoms in the DNA bases, often through hydrogen bonding or LDFs. Through binding to DNA, transcription factors can then signal to RNA polymerase to bind to the gene promoter and increase the likelihood that transcription will occur.
Section 4.4 Process of Transcription
To get an overview of the gene expression process, please play with the gene expression simulation below. For now, just try the Expression simulation and focus on Gene 1. Note that in this simulation, the promoter is within the regulatory region indicated. Grab proteins from the toolkit and write down what it takes to make an RNA!
Figure 4.5b shows transcription in progress and how the template strand (in this case, the bottom strand) is used in transcription. Note that between parts a and b of Figure 4.5, several important steps have occurred. First, the DNA strands have partially separated from each other. This is due to RNA polymerase, indicated in the model by the tan oval. Second, RNA polymerase has already synthesized ~40 nucleotides of the RNA strand, meaning that it has taken free RNA nucleotides and connected them by creating covalent phosphodiester linkages between them.
Notice that the RNA molecule shown in Figure 4.5b is single-stranded, and has a 5’ and 3’ end. The polymerase enzyme moves along the template strand from 3’ to 5’ (left to right in this image, as indicated by the arrow), and synthesizes the new RNA from its 5’ end to its 3’ end, adding new nucleotides onto the 3’ end. Only the DNA within RNA polymerase is base pairing with RNA. Notice the modified base pairing rules: C and G in DNA pair with G and C in RNA, respectively, and T in DNA pairs with A in RNA, but because there is no T in RNA, A in DNA pairs with U in RNA. RNA nucleotides (not shown) feed into the RNA polymerase and can base pair with the DNA template. When the correct pairing occurs, RNA polymerase creates the covalent phosphodiester linkage to connect the next RNA nucleotide to the 3’ end of the strand. In Figure 4.5b, we see the last nucleotide of the RNA strand, G, is paired with C in the DNA. Because this is the 3’ end of the strand, the next nucleotide will be added here. The next letter in the DNA strand is A, so what will the next RNA nucleotide be?
Because RNA polymerase synthesizes 5’ to 3’, reading the DNA template from 3’ to 5’, we can infer that the DNA to the left of the enzyme in Figure 4.5b has already been read. The 5’ end of the RNA sticking out from the enzyme is no longer base paired with the DNA and the DNA double helix has reformed as the enzyme continues down the template. To the right of the enzyme is template DNA that has yet to be read, and is also a double helix of DNA. Thus, the process of transcription only temporarily disrupts the structure of DNA, breaking only the weak hydrogen bonds between strands briefly to create the RNA strand as part of the process of transferring information from DNA to RNA. Overall, the genetic information in DNA (the specific sequence of nucleotides) is maintained by the phosphodiester linkages between DNA nucleotides, which are unaffected by the transcription process. Meanwhile, as RNA polymerase transcribes and creates the RNA strand using the DNA template, it’s creating new phosphodiester linkages between the RNA nucleotides, copying the genetic information into this new molecule.
Formation of the Covalent Phosphodiester Linkage
Figure 4.7 shows more molecular detail of the formation of the phosphodiester linkage. In Figure 4.7a, we see one of the four RNA nucleotide building blocks. Notice how this nucleotide has three phosphates, whereas the monomers in the chain have only one phosphate (represented as dots in Figure 4.7b). Each elongation reaction in RNA strand synthesis releases these two phosphates to provide the energy needed to synthesize the macromolecule. In Figure 4.7b, the right side of the model shows the DNA template strand oriented with its 3’ end at the top of the figure, and on the left side of the model is the growing RNA strand (notice the 2’ OH groups on the RNA strand that are absent on the DNA strand). The new RNA strand is antiparallel to the DNA strand (notice the 5’ end of the RNA paired with 3’ end of the DNA), and a few nucleotides of the RNA strand are base paired with the DNA template. The free hydroxyl group on the 3’ carbon of the last RNA nucleotide to be added to the chain is where the next nucleotide will be added. Since the next RNA nucleotide will need to pair with the A in the DNA, the next RNA nucleotide added is U.
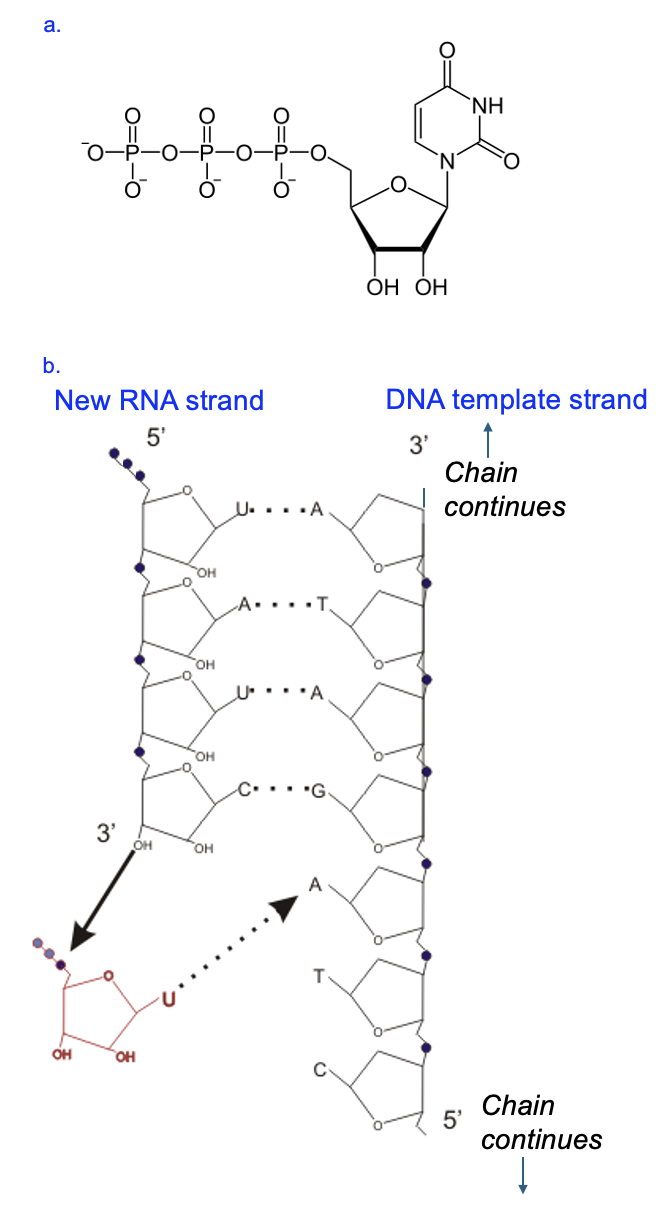
As shown in figure 4.7b, as the U nucleotide comes into position, hydrogen bonds stabilize the interaction between A and U. Then the hydroxyl group on the C reacts with the phosphate closest to the sugar on the incoming U nucleotide, forming the phosphodiester linkage is formed. Simultaneously, the two other phosphates on U are broken off. Thus, the phosphodiester linkage is between the 3’ hydroxyl group of one nucleotide and the phosphate group of the next nucleotide. Now the free 3’ OH is on the U, and the next nucleotide will be added by a reaction with that hydroxyl group. Based on the model, what is the nucleotide that would be added to the U? What nucleotide comes after that?
Even though the RNA polymerase enzyme is not shown in Figure 4.7, we can infer its presence and even the direction in which the enzyme created this strand. Nucleic acid synthesis always occurs 5’ to 3’, largely due to the energy requirements to form the phosphodiester linkages. Thus, the first RNA nucleotide of the chain is at the 5’ end, and the most recently added nucleotide is at the 3’ end. Therefore, relative to the model in Figure 4.7, the enzyme moves from top to bottom, building the new strand antiparallel to the DNA template that is read from 3’ to 5’.
Tips for reading nucleic acid sequences
Many of us are comfortable reading from left to right or top to bottom. However, in the context of genetic information, this directionality isn’t meaningful as everything in living organisms is based on chemistry. Therefore, to determine the direction of transcription, focus on those 5’ and 3’ labels. If these aren’t labeled, remember that there is a phosphate group on the 5’ end and a hydroxyl group on the 3’ end. Sequences can only be added to (extend off of) 3’ ends. Even when the chemical details are not represented, we need to apply what we know about nucleic acid sequences to identify those ends of nucleotides or nucleic acid strands, because that information is key for predicting and explaining what will happen next. This is something you can practice with every diagram and sequence you see!
However, it may help to rewrite sequences in a more convenient orientation, while keeping the order and ends consistent. For example, the sequence 5’-CTAAG-3’ could be written 3’-GAATC-5’. As we practice with transcription and later translation, rewriting sequences can help you check your work and verify your thinking.
Section 4.5 Cellular Location of Transcription
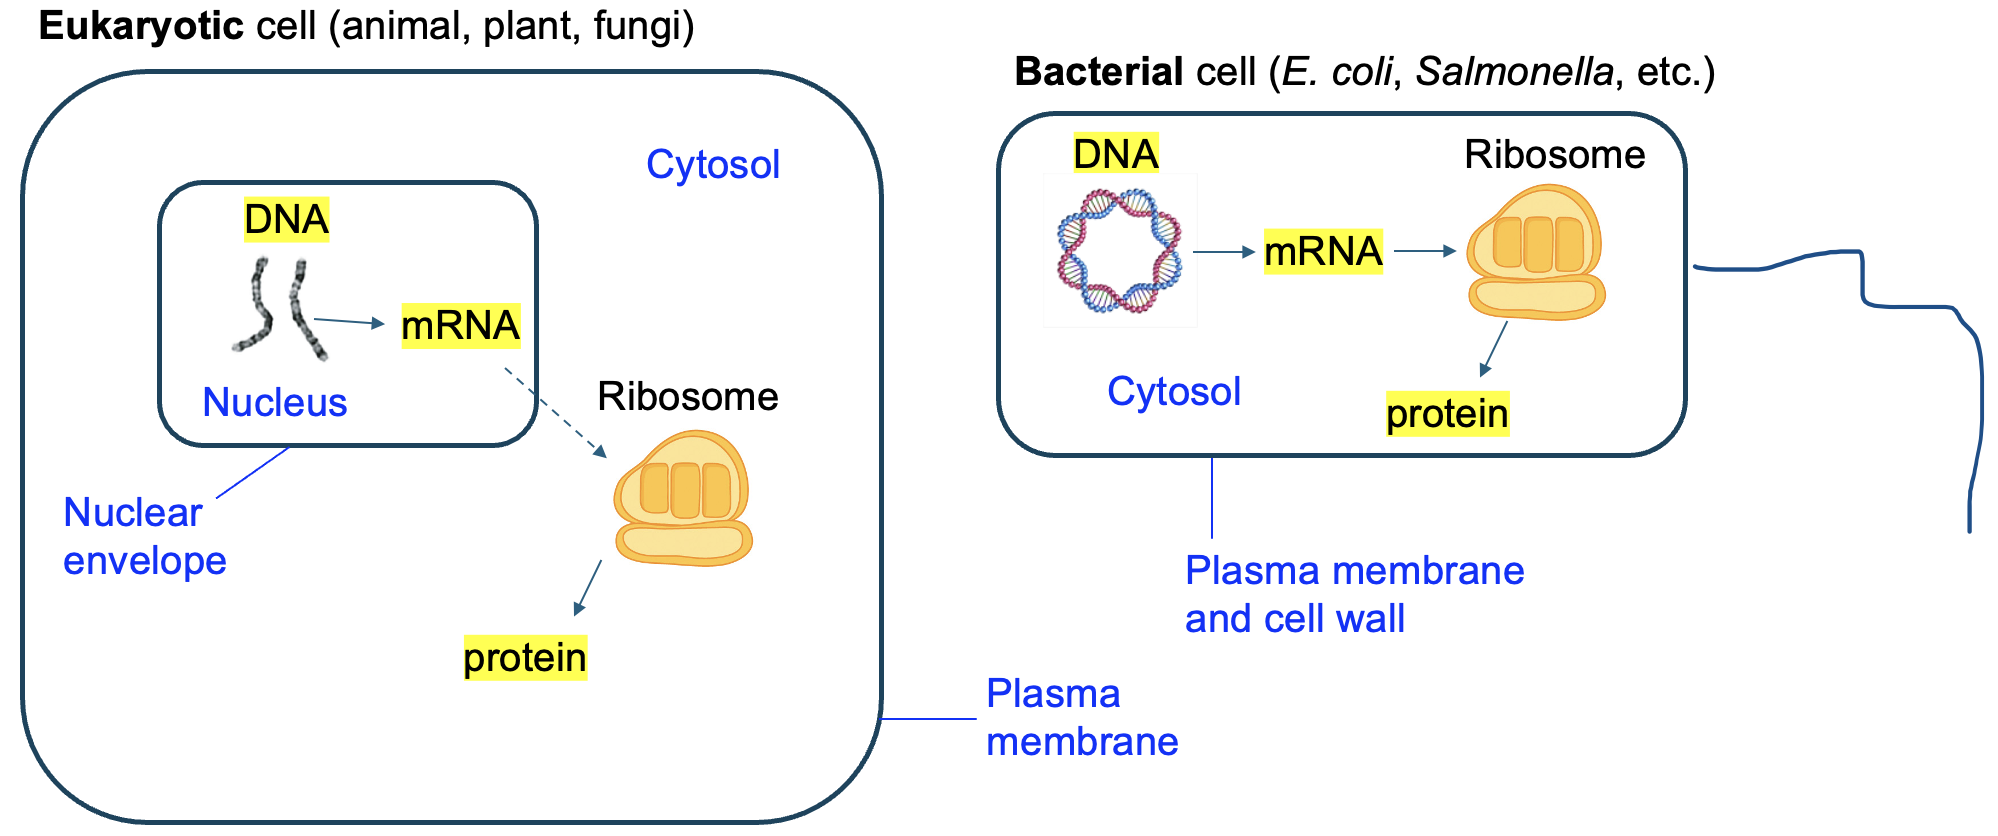
While all cells perform transcription, different types of cells perform the steps in different locations. As we discussed in Chapter 1, eukaryotic cells (such as those that comprise your body) have an internal compartment called a nucleus where the DNA is housed. Because transcription requires the DNA, and the DNA is in the nucleus, the process of transcription takes place within the nucleus (Figure 4.8). In contrast, bacterial cells, like those of E. coli or Salmonella, have no internal compartments. Transcription still occurs where the DNA is located, which is in the cytosol of a bacterial cell (Figure 4.8). This is a variation on the structure-function theme: the different structure of cells has consequences for where certain functions occur.
able to cause an infection
physical or observable characteristics or traits
macromolecule made up of nucleotides that stores and transmits genetic information
the monomer building block of a nucleic acid, consisting of a phosphate, 5-carbon sugar, and a nitrogenous base
a series of covalent bonds that joins nucleotides in a nucleic acid strand
interaction between complementary nitrogenous bases in nucleic acids (example: in DNA, adenine interacts with thymine, and guanine interacts with cytosine)
enzyme that separates DNA strands and synthesizes a new RNA strand based on the template DNA, creating covalent phosphodiester linkages between RNA nucleotides
all the DNA in a cell
double-stranded DNA sequence, bound by RNA polymerase, that indicates where transcription should begin and the direction of transcription
double-stranded DNA sequence that indicates where transcription should end
proteins that help attract RNA polymerase to promotes and increase the likelihood of transcription
