
16 Cell Division and the Cell Cycle
Cell division—the process of one cell becoming two cells, each genetically identical to each other and to the original (parent) cell—is one the most complex and radical events in the life of a cell. To carry out cell division, a cell needs to create a copy of its entire DNA sequence (DNA replication), and ensure there is enough membrane, proteins and ribosomes to divide among the new (daughter) cells. Cell division in eukaryotic cells is additionally complicated by the need to create more organelles, break down and reform the nucleus, and accurately divide numerous segments of DNA among daughter cells. All of this requires extensive new gene expression, energy, and regulation to ensure the cell division process works correctly and under correct the circumstances. If something goes wrong in the cell division process, it could result in cells that can’t survive (non-viable), or cells that divide abnormally, leading to cancer.
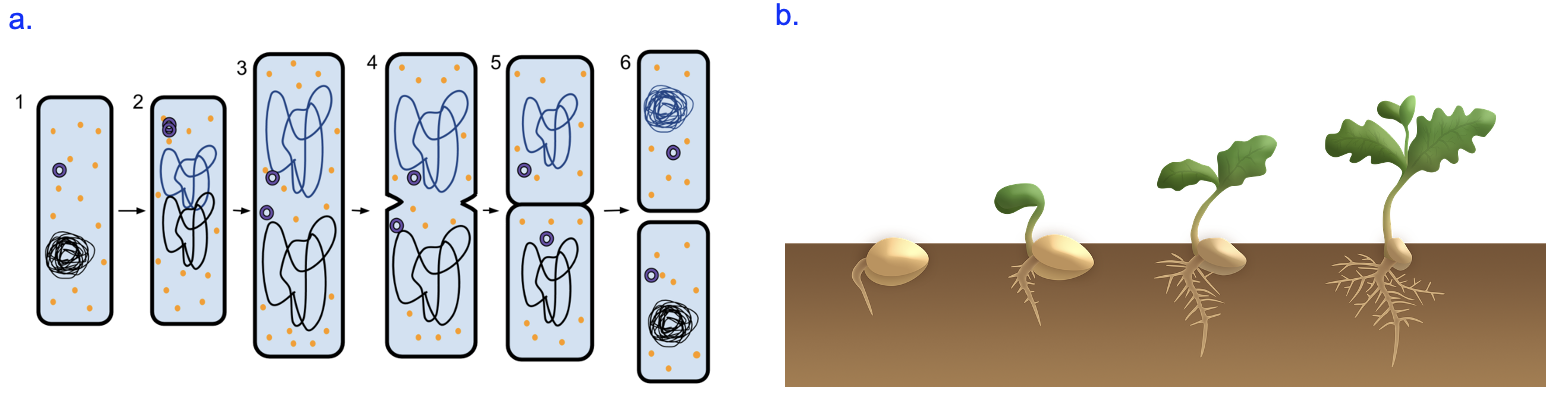
The cell theory states that all cells arise from pre-existing cells; thus, the process of cell reproduction is essential for life to continue. For single-celled organisms like bacteria, cell division (by binary fission) is how more bacterial cells are made (Figure 18.1a). Multicellular organisms, such as animals and plants, start as fertilized, single-celled eggs that undergo many, many rounds of cell division (by mitosis) to reach their mature states (Figure 18.1b). Additionally, multicellular organisms use cell division to replace worn out or damaged cells.
Section 18.1 Eukaryotic Chromosomes
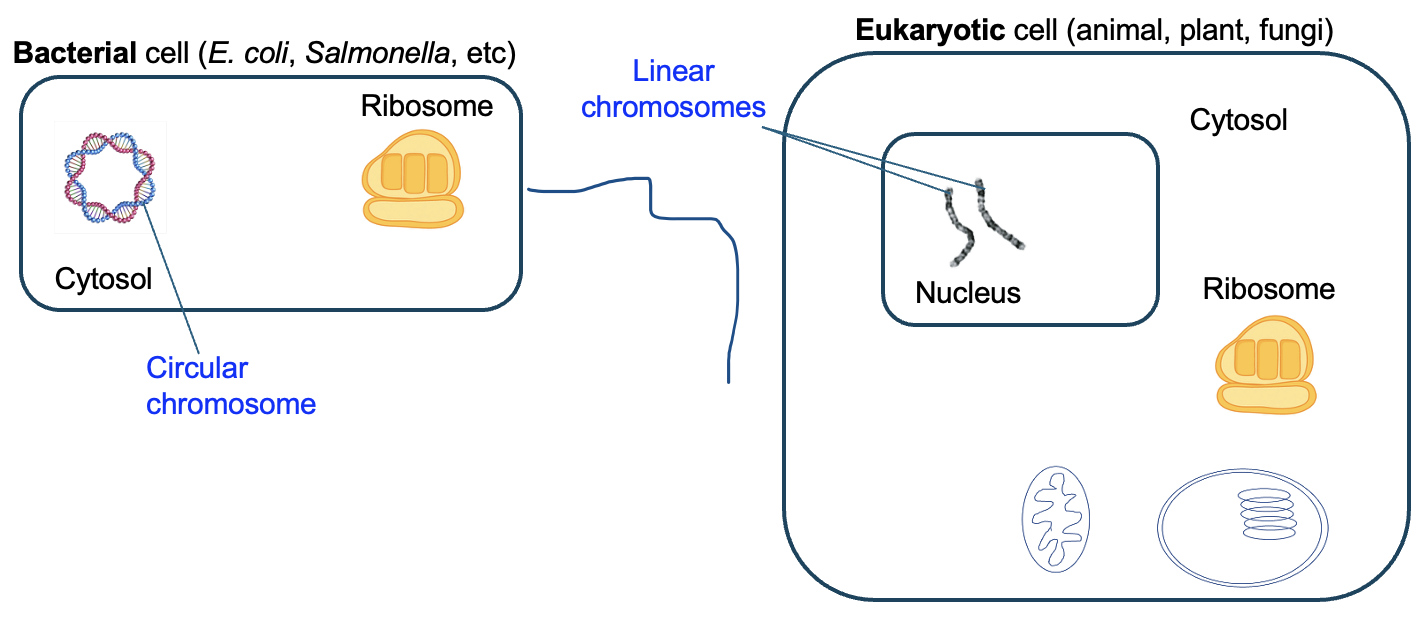
This chapter will focus mainly on the eukaryotic cell cycle, which is the series of steps by which eukaryotic cells divide. While eukaryotic cell division follows the same general process as binary fission of bacteria shown in Figure 18.1a, the process in a eukaryote is much more complex and regulated. The most obvious complication of eukaryotic cell division is due to the different organization of genomic DNA in eukaryotes. Instead of the single, circular chromosome found in bacteria, eukaryotes have their genes in linear segments of DNA, each of which is a chromosome (Figure 18.2). To produce genetically identical daughter cells, each of these chromosomes needs to be replicated and accurately divided among daughter cells. We will learn in Chapter 19 how these processes are controlled and regulated.
For most of the life of a cell, its DNA is loosely organized within the nucleus, wrapped around protein complexes called histones, and may be more tightly compacted by additional scaffolding proteins to create chromatin fibers that are 30 nanometers (nm) in diameter (Figure 18.3, 2nd and 3rd rows). In some cases, the DNA is further organized into much thicker bundle by further coiling and looping.

If we were to look at an individual cell under the microscope and visualize the DNA using a fluorescent stain, we would see a diffuse mass of staining in the nucleus (Figure 18.4, middle and right cells). However, during the brief portion of the cell cycle in which the DNA is actively being divided, the chromatin is compacted to a much greater extent, forming the distinctive “X” shape of a chromosome in mitosis (Figure 18.3, bottom row). For cells, this compaction makes the DNA easier to accurately divide and reduces the chances of DNA being damaged during the cell division process. For us, it also allows for easier visualization of chromosomes under the microscope! In Figure 18.4, the leftmost cell has fully condensed chromosomes that are beginning to organize themselves in preparation for imminent cell division.

If we were to take one of your cells, remove the chromatin and condense it into chromosomes, we would observe 46 linear pieces of DNA. If these pieces were arranged by their lengths, we would be able to create 22 pairs of chromosomes, with each chromosome in the pair having an identical length. These are called autosomal chromosomes and are numbered 1-22. Some people have a 23rd pair of chromosomes that are identical in length, while others have two chromosomes of very different sizes. These are the sex chromosomes, and genetic females have two X chromosomes, while genetic males have one X and one Y chromosome. For each chromosome pair, one came from one genetic parent, while the other came from the other genetic parent.
Figure 18.5 shows an intact nucleus of a cell (top), unarranged condensed chromosomes (right side), and the condensed chromosomes arranged in pairs (left side). The chromatin and chromosomes have been stained with a mixture of dyes in which each dye only binds to the sequences on one type of chromosome. We see that pairs of chromosomes appear with the same color, and thus the sequences are similar enough to for the same dye to bind to each. The paired chromosomes are called homologous chromosomes because they contain similar information. If we were to zoom in further and read the DNA sequences of a pair of chromosomes, we would see that they are highly similar, containing the same genes in the same order.
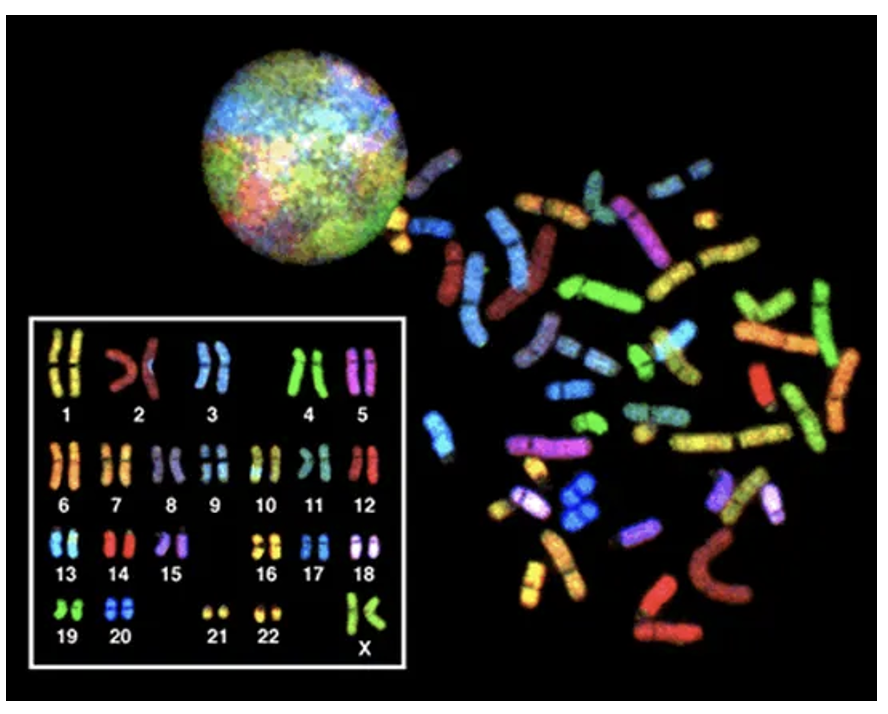
Importantly, though, homologous chromosomes are not identical— roughly 5% of the base pairs may be different when sequences are compared. This can impact the sequences of genes and the proteins they encode. While a person usually has two copies of every gene, one on each homologous chromosome, or homolog, these sequences may encode slightly different versions of a protein. These different versions of gene sequences are called alleles. In Chapter 6, we saw two versions of the beta globin gene, A and S. The A version results in a typical hemoglobin protein, while the S version results in sickle cell hemoglobin. A person may have two A alleles, one A and one S allele, or two S alleles.
Interestingly, the number of chromosomes varies widely from one species to another. While humans have 46 chromosomes, fruit flies have 8, cats have 38, and dogs have 78. But in all these cases, chromosomes occur in pairs, and this seems to be important for producing healthy cells. In the case of human embryos, having more than or fewer than two of an autosomal chromosome is often lethal. The genomes of cancer cells often have atypical numbers of chromosomes as well. These facts underscore the importance of maintaining the number of chromosomes during cell division.
Chromosome models
To help us visualize what happens to chromosomes during the cell cycle, we will draw models of chromosomes that highlight the genetic information, including showing specific genes and sequences. Figure 18.6a shows two chromosomes, before and after DNA replication.
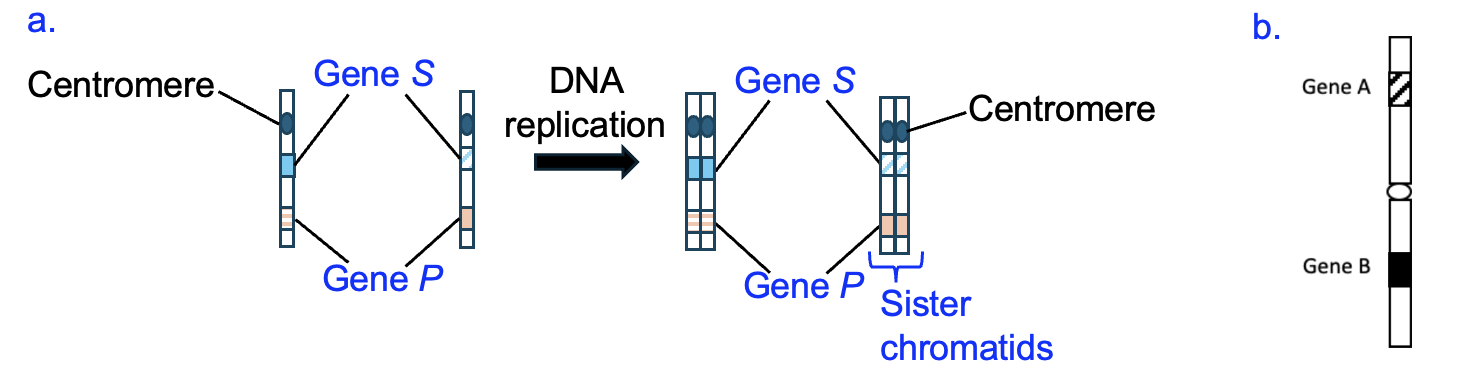
We can see that each chromosome has two genes labeled, and the same genes are labeled on each chromosome, in the same positions relative to the centromere. We can also see that these chromosomes are equal in length, with centromeres in the same position across chromosomes. Because they have the same genes in the same location, we know these chromosomes are homologs, forming a homologous pair. However, while both homologs contain the same genes, the sequences of these genes might be slightly different, or be a different allele of the gene. To illustrate this, the gene on one chromosome has a different shading pattern than on the other chromosome. We could go further and add DNA sequences to the model to illustrate those differences, but we’ll show that in a later model. Instead, contrast our homologous pair of chromosomes with the chromosome in Figure 18.6b, which we created earlier. Would you say the chromosome in Figure 18.6b is homologous or non-homologous to the chromosome in Figure 18.6a? Since these chromosomes have different genes, these are non-homologous.
Going back to Figure 18.6a, notice how there are two chromosomes before DNA replication, and two chromosomes after DNA replication. These are considered homologous chromosomes in both cases, but after replication, each chromosome consists of two sister chromatids that remain attached to each other until late in the cell division process. DNA replication makes an exact copy of the DNA sequence, and our model could additionally show that each sister chromatid within a chromosome has the same sequence. I think sister chromatids are misnamed, as they are genetically identical and thus are more like identical twins. So if you ask me, we should call them “twin chromatids!”
Section 18.2 Eukaryotic Cell Cycle Events: Interphase
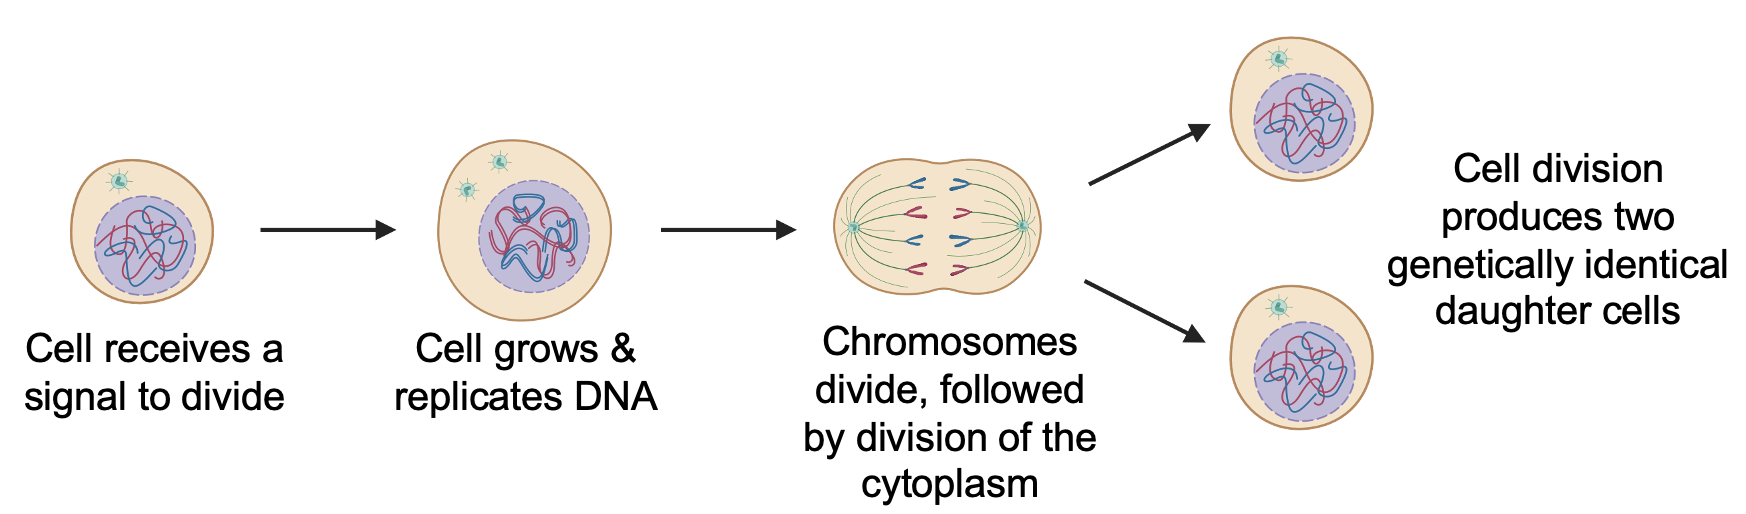
As we consider the events of the cell cycle, please keep in mind the outcome: cell division produces two genetically identical daughter cells. In this section, we will focus on the specific steps that occur in the cell cycle to produce two genetically daughter cells, while the next chapter (Chapter 19) will discuss how, to ensure that outcome, the steps are regulated and mistakes are detected and fixed.
All dividing cells follow roughly the same steps in the same order: a cell receives a signal to divide (the ligand for this can be a growth factor or mitogen), leading to cell growth and DNA replication, followed by the division of the chromosomes and the rest of the cell, to produce two genetically identical daughter cells from the one parent cell (Figure 18.7).
Among cells, differences emerge in the overall timing of a cell division cycle, the length of time spent in a given phase of the cell cycle, and how often cells divide. During early development of an embryo, cell cycles are frequent and short, allowing for rapid production of new cells that allow organisms to grow in size. In mature organisms, different types of cells have vastly different rates of cell division. In your body, new blood and skin cells are constantly produced (you produce millions of blood cells every second!), liver cells divide roughly once per year, and healthy neurons in your brain never divide. Importantly, the rates of cell division of some cells are influenced by environmental factors. For example, physical injury releases signals that promote cell division to replace damaged cells. Meanwhile, exercise and taking certain antidepressants stimulate the production of new neurons.
The steps of the cell cycle can be divided into two segments: interphase and M phase (Figure 18.8). The length of each segment roughly indicates the proportion of a cell cycle spent in each phase. Nearly all images of dividing cells are from M phase, as this is when condensed chromosomes are visible and the DNA and cell contents are divided. The name “interphase” refers to the time between M phases, when the cell is not changing much in physical appearance and thus weren’t as interesting to look at under the microscope. Please don’t be fooled—cells in interphase are busy, carrying out the many steps and checks needed for eventual cell division. Each phase will be covered in more detail below, and Figure 18.8 summarizes the main events. For each phase, be able to describe the changes in chromosomes, changes in the DNA amount, and other physical changes to the cell.
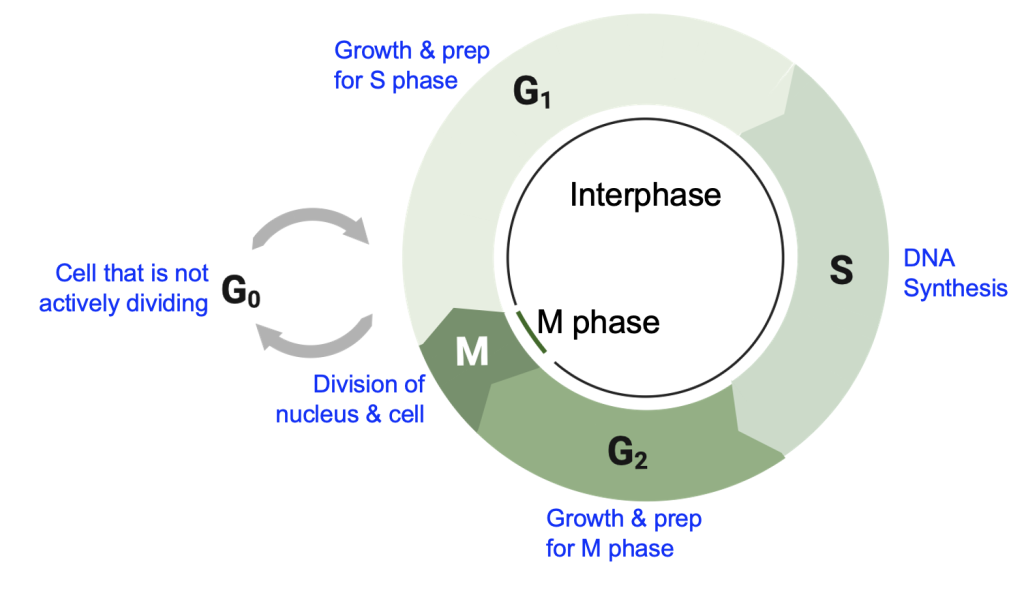
G0 to G1
Most of the cells in your body are not actively dividing and are therefore in G0. These cells are metabolically active, expressing genes, synthesizing molecules, and using energy to organize their internal environments. But they aren’t replicating their genomes or producing structures needed for cell division. To enter the cell cycle, these cells must receive a signal, such as the growth factors described in Chapter 17, leading to changes in gene expression associated with actively dividing cells. We will learn more about those genes in Chapter 19.
G1 Events
In G1, or the first “gap” phase, cells are growing, synthesizing new proteins and cellular structures to physically have enough material to eventually divide. Cells in G1 are also actively preparing for S phase, in which DNA replication occurs. We will discuss the details of DNA replication in Chapter 20, but you can use your knowledge of nucleic acids to predict the types of monomers that will be needed for DNA synthesis. Large-scale DNA replication only occurs in S phase of dividing cells, and cells don’t normally produce the enzymes and other proteins associated with DNA replication until just before they are needed. No DNA replication occurs in G1 phase, but cells do check that they are of sufficient size, and that enough energy and materials are available to advance in the cell cycle.
S Phase Events
S phase is the DNA “synthesis” phase. During this phase, DNA replication is actively occurring, leading to measurably higher DNA amounts in each cell. Thus, the DNA amount per cell is increasing during this phase. By the end of this phase, the DNA amount per cell should be double the amount found in the G1 cell.
G2 Phase Events
G2 is the second gap phase of the cell cycle, during which the cell prepares for M phase, when actual cell division occurs. Cells continue growing, synthesizing proteins needed for M phase, and new organelles are produced. DNA replication should be complete, or at most only a small amount of DNA synthesis should be remaining. A structure called the centrosome is also duplicated in G2, and we will shortly see its function the division of DNA.
As shown in Figure 18.6a, after DNA replication is complete, the DNA of each chromosome should be duplicated such as that each chromosome now contains two identical sister chromatids. These sister chromatids (or twin chromatids!) remain attached to each other by cohesin proteins, so they behave as a single unit. Thus, the chromosome number is unchanged, even as the amount of DNA has doubled. On your own, draw the chromosome from Figure 18.6b in G2, after S phase is complete. How many chromosomes did you draw? How did you indicate the effect that DNA replication has? What could you add to your model to show that the sister chromatids have identical information?
Section 18.3 Eukaryotic Cell Cycle Events: M Phase
M phase, while a short part of the overall cell cycle, is visually most exciting because we can see many of the key steps (with the aid of a microscope, of course!). M phase can be divided into two somewhat overlapping stages: mitosis, which is the division of the nucleus, and cytokinesis, which is the division of the cell and its contents. To enter M phase, DNA replication must be complete, as each daughter cell needs a complete set of genetic information from the parent cell.
The start of mitosis of M phase is indicated by several major changes to the appearance of the cell. First, the DNA begins to condense, eventually forming visible chromosomes so they are easier to manipulate. Second, each centrosome (duplicated in G2) migrates to opposite poles of the cell and begins to send out long, rod-like structures called microtubules (these are also known as spindle fibers) towards the center of the cell. The array of microtubules produced by both centrosomes is called the mitotic spindle. These spindle fibers extend and retract, searching for a chromosome to bind to. However, you can see in Figure 18.9a (left and middle cells) that this spindle is forming in the cytosol of the cell, but the chromosomes are in the nucleus. Thus, another major change in early mitosis is the breakdown of nuclear envelope that normally surrounds the nucleus, allowing spindle fibers to access the DNA in the nucleus. The cells in Figure 18.9b are onion root tip cells stained with a dye to reacts best with densely packed DNA. In an interphase cell (left cell), only the nucleolus of the nucleus is densely stained, while the loosely packed chromatin in the nucleus is barely visible inside the nuclear envelope. As the cell progresses into mitosis of M phase, the nuclear envelope disappears as the chromatin condenses into visible chromosomes (Figure 18.9b, right cell).

Figure 18.9c shows a closer view of a chromosome that has attached to spindle fibers. Near the centromeres of the chromosome, certain proteins have assembled into a complex called a kinetochore. Spindle fibers bind to kinetochores on one chromatid and begin shortening, pulling the chromosome towards the pole (Figure 18.9a, right cell). Although the spindle fiber binds to only one chromatid, remember that the chromatids are attached together by cohesin proteins. Eventually, spindle fibers from the other centrosome will attach to the other chromatid, providing tension in the opposite direction.
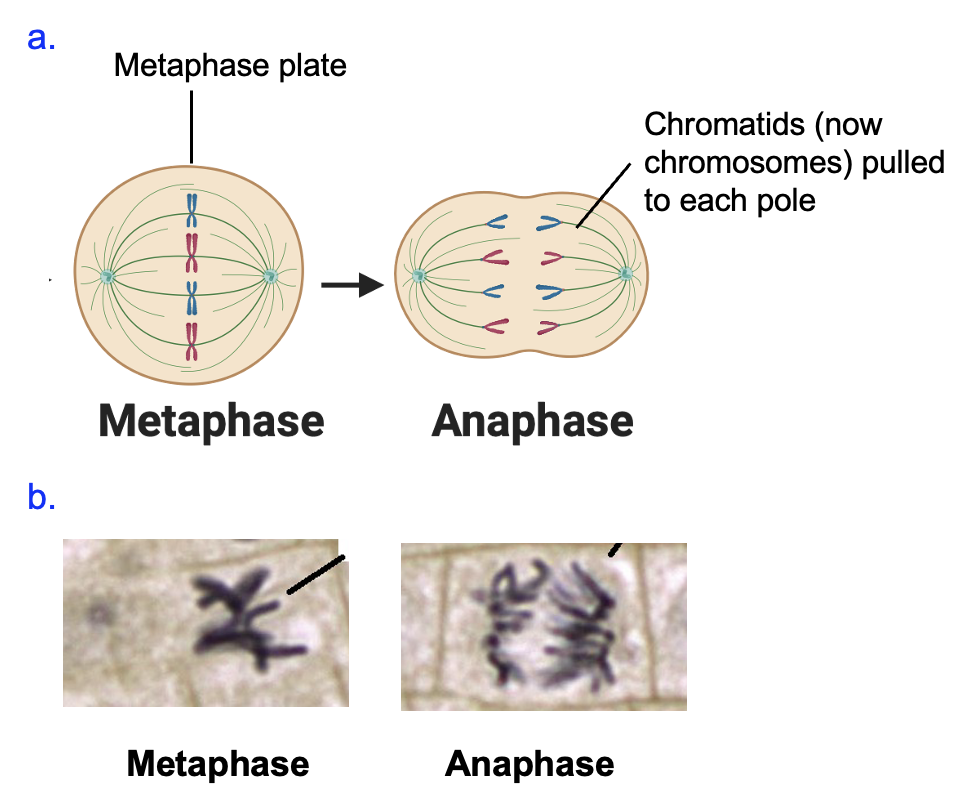
This attachment on both sides of the chromosome (one pole attached to one chromatid, the other pole attached to the other chromatid) results in the movement of chromosomes to the middle of the cell (Figure 18.10, left cells). This alignment of chromosomes in the middle of the cell, caused by the lengthening and shortening of spindle fibers attached to chromosomes, is called metaphase. The correct attachment of chromosomes to the mitotic spindle leads to the destruction of the cohesin proteins connecting chromatids of a chromosome, allowing each chromatid to be pulled by its spindle fiber to the poles of the cell. One sister chromatid goes to one pole, and the other chromatid to the other pole. This movement of chromatids apart from each other is anaphase.
Once the DNA has been divided, mitosis finishes by resetting conditions back to their appearance in interphase: the chromosomes decondense to chromatin, the nuclear envelope reforms, and the mitotic spindle disassembles. Simultaneously, cytokinesis divides the cellular contents of the parent cell into two cells. In animal cells, this occurs when a ring formed around the middle of the cell contracts and creates a cleavage furrow (Figure 18.11a). In plant cells, a cell wall forms in the middle of the cell (Figure 18.11b). Overall, the process of mitosis followed by cytokinesis reduces the amount of DNA in the cell by half, returning it to the original amount in G1.

Section 18.4 Cell cycle analysis
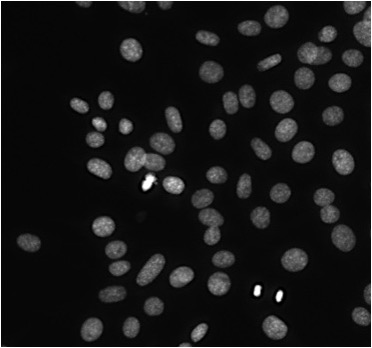
Up until this point, we have been focused on single cells, and the changes to DNA and other molecules in that one cell over the course of the cell cycle. However, it’s very difficult to track the DNA and other features in a single cell. Instead, we find it easier to study populations of cells, usually thousands to millions of cells. Within these populations, cells may be in different phases of the cell cycle, if they are dividing at all. Figure 18.12 shows cells that were grown in the lab and stained with a dye that fluoresces when in binds to DNA, so we are just seeing the nuclei of these cells. We can see that some nuclei are brighter than others, indicating different amounts of DNA or different densities of DNA, which correspond to different phases of the cell cycle.
Because we know how the DNA amount per cell changes over the course of the cell cycle, we can use that as a tool to measure the proportion of cells that are in each phase of the cell cycle. First, the amount of DNA per cell is measured by a machine that can detect fluorescence. Then, the number of cells with each amount of DNA is plotted on a histogram.
Figure 18.13 shows a typical result for a normal population of cells, and the area under the curve represents the number of cells with a specific amount of DNA. The largest peak on graph, labeled A, corresponds to many cells that have the lowest amount of DNA per cell. Then there is a population of cells with intermediate amounts of DNA (B), while a smaller peak indicates cells with the most DNA per cell (C), double the amount in the first peak.
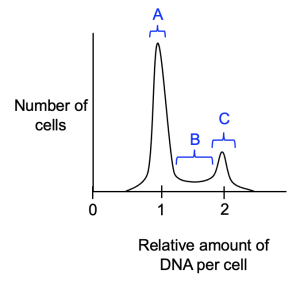
Let’s recap our knowledge from earlier in the chapter—at what cell cycle stage is the amount of DNA in the cell at its highest level? After DNA replication is complete, so in G2. What causes the DNA amount to decrease? Cytokinesis, at the end of M phase. Once cells complete M phase, what cell cycle phase do they enter? G0 or G1, which the DNA amount is back to the starting value (half of the level in G2). Therefore, population C represents cells in G2 and M phase, population A represents cells in G0 or G1 phase. Population B represents cells in S phase, in the process of replicating DNA, which increases the amount of DNA in each cell. Because the cell cycle is a series of steps that occur in a specific order, we know that cells in population B (S phase) have already moved through G1, but have yet to complete replication and move into the G2 phase (population C). Cells in population C have completed replication, but need to go through M phase to return to G0 or G1 (population A).
We can use this type of analysis to determine the functions of proteins on the cell cycle, or assess whether a new drug will be a useful cancer therapy. For example, if we have a drug that we think will slow DNA replication, we could use this type of analysis to verify how the drug works. We would predict that, because S phase takes longer, more cells would be S phase in the drug-treated cell population. Thus, the area under the curve for S phase cells would increase. Consequently, because cells are slower to move out of S phase and into G2, the peak that represents G2/M cells would decrease. Finally, cells in G1 would enter S phase at a normal rate, but as there are fewer cells in G2/M, there are fewer cells returning to G0 or G1 after finishing cell division. Thus, the peak that represents G0 and G1 would also decrease in size. To recap, we would expect that a drug or mutation that slows DNA replication would cause increased numbers of S phase cells, and fewer numbers of cells at other stages of the cell cycle. Going back to Figure 18.13, this means that height of population B would increase, while the peaks for populations A and C would be lower in height.
On your own, think about and draw graphs to illustrate the predicted effect of a drug that causes cell to pause in G1, G2, or M phases (they all exist!). The basic rule of thumb is if a cell cannot complete a phase or cannot start the next phase, the corresponding region of where cells are stuck would increase in size as cells accumulate at that part of the cell cycle. Consequently, the populations of other phases decrease in size. As you build your graphs, think about the events of the cell cycle at G1, G2, or M phases, to hypothesize what the drug might target to result in pauses at these points in the cell cycle. These types of drugs are not only useful for studying the cell cycle, but are very effective anti-cancer therapies, when excess cell division needs to be slowed.
