
10 Bioenergetics and Enzymes
Learning Objectives
- Use principles of equilibrium to explain the difference between energetically favorable vs energetically unfavorable processes
- Explain how cells use ATP to drive processes that would otherwise be energetically unfavorable
- Use a model to explain the role of enzymes in the rate and specificity of favorable chemical reactions
Energy is something we are all familiar with at a basic level—we know that we need to eat to fuel our bodies, just as we know our devices need to be charged so we can use them. Put simply, energy is the ability to work. At the cellular level, energy is required to support the many activities that cells carry out, such as building macromolecules, transporting molecules, and reproducing themselves. Cells must obtain energy and materials from the environment to support these and other functions.
In this and later chapters, we will discuss common forms of energy and how these are generally used by cells. This will set the stage for understanding two fundamental metabolic pathways—cellular respiration (Chapter 13) and photosynthesis (Chapter 14). Finally, we will combine our knowledge of gene expression and metabolic pathways, learning how pathways can be manipulated to change an organism’s metabolism in a way that causes it to produce a biofuel (Chapter 15).
Chapter Outline
Section 10.1 Thermodynamics and Equilibrium
Section 10.3 Free Energy Changes Associated with Molecule Movements
Section 10.4 Free Energy Changes Associated with Chemical Reactions
Section 10.5 Energetic coupling
Section 10.1 Thermodynamics and Equilibrium
Before we can delve deeply into the biology, we first need to investigate the physical and chemical aspects of energy, starting with the laws of thermodynamics.
Laws of Thermodynamics
The first law of thermodynamics states that energy may be transformed from one form to another, but it cannot be created or destroyed. For instance, muscle cells need to contract for your limbs to move. The energy of movement is kinetic energy. To perform this action, muscle cells use ATP, which is an energy source in many cellular reactions. When ATP is converted to ADP + Pi, energy is released, as ATP has higher potential energy than ADP + Pi. ATP is analogous to a rock at the top of a hill, which has higher potential energy than a rock at the bottom of the hill. As we will see when we discuss cellular respiration, cells maintain high concentrations of ATP by breaking down sugars and other nutrients in the foods we eat, using the energy released from the breakdown reactions to synthesize ATP. Plant cells, due to their chloroplasts, can capture light energy (kinetic energy) and use it to convert carbon dioxide and water to sugar and O2. Sugar has higher potential energy compared to carbon dioxide, allowing it to serve as an energy source for cells. These and other transformations convert energy into forms that are easier for cells to use, transport, or store.
In all cases described above, energy is converted from one form to another without any energy being destroyed. However, the second law of thermodynamics states that the entropy, or disorder, increases with each energy transformation. Some energy, often heat energy, is produced in the transformation process, and that type of energy is not usable by cells. Put another way, each energy transformation reduces the amount of energy that is available to do work.
Equilibrium
One final concept to keep in mind during any discussion of energy is equilibrium. An equilibrium state represents the lowest possible energy state of a system. A system includes all components of the energy transformation process, in contrast to the surrounding environment outside the system. Over time, systems move tend towards equilibrium states, where entropy is high. When applied to chemical reactions, equilibrium is reached when the rate of the forward reaction equals the rate of the reverse reaction (this could also be described as “no net reactions occurring”). When applied to the movement of molecules, equilibrium is reached when no net molecule movement occurs. For molecules with no net charge, equilibrium is reached when molecules are evenly distributed in space. Chemical reactions or molecule movements that bring a system towards equilibrium release energy and increase entropy. It follows, then, that any system in which there is net molecule movement, or in which net chemical reactions are occurring, is a system that is not at equilibrium.
Figure 10.1 shows three cells with varying concentrations of a small red molecule inside and out of the cell. In the top cell (Figure 10.1a), the concentrations of the molecule are equal in both the interior and exterior compartments. Assuming this molecule can cross the membrane and has no net charge, we would predict that the number the molecules entering the cell would equal the number of molecules exiting the cell— although molecules never stop, no net movement occurs under these conditions. This system is at equilibrium and at its lowest energy state, and there is no energy available do to work.
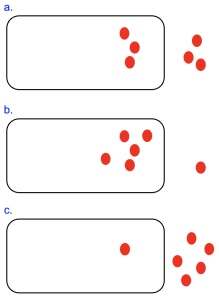
In contrast, the cells in Figure 10.1b and 10.1c are not at equilibrium. We can see that there are different numbers of molecules inside the cell versus outside. Furthermore, we can predict what would bring this system to equilibrium—in the case of Figure 10.1b, molecules would need to be transported out of the cell until the numbers are balanced, a movement that releases energy. The opposite movement is needed to bring the system in Figure 10.1c to equilibrium. As we will see in Chapter 11, cells can use the energy released as molecules move towards equilibrium conditions to do other work in the cell, such as moving other molecules to a specific location.
Chemical reactions also have equilibrium states, though these are harder to visualize. Let’s consider a generic chemical reaction with letters representing reactants and products.
A + B [latex]\rightleftarrows[/latex] C + D
Remember that in a chemical reaction, covalent bonds are broken in the reactants, and new covalent bonds are formed to produce the products. The double-sided arrow in the reaction tells us that this reaction is reversible. The forward reaction, reading from left to right, uses A and B to produce C and D, while the reverse reaction uses C and D to produce A and B. The terms “reactant” and “product” are usually applied to the forward reaction as written, but you can probably see how this gets counterintuitive when describing the reverse reaction! To be clear, use the specific chemical names of the reactants and products when possible.
As described above, the equilibrium state for a chemical reaction is when the rate of the forward reaction is the same as the rate of the reverse reaction. Assuming our generic chemical reaction is an isolated reaction system (not influenced by other chemical reactions), if we observed that the levels (concentrations) of each reaction component were unchanging, we could conclude the reaction system is at equilibrium. Note—this does not mean that each component (A, B, C and D) is equal in concentration, just that the concentrations (whatever they may be) aren’t changing. Every reaction has its own equilibrium that must be experimentally determined and can be reported as a ratio of products to reactants.
As with molecule movements, chemical reaction systems naturally tend towards equilibrium, and we can likewise predict how a change in reaction conditions would affect the system by identifying what would return the system to equilibrium. Le Chatelier’s Principle describes this process as such: a change in molecule concentrations causes the reaction to occur in the direction that will return the system to equilibrium ratios of reactants to products. Going back to our generic example, if a large quantity of A and B is added to a reaction system that was at equilibrium, C and D will be produced to return the system to equilibrium. Likewise, if a large quantity of C and D is added, A and B will be produced.
Connection to Cells
How does this connect to the functions of cells? Well, cells are highly ordered and organized, with specific chemical reactions occurring in specific directions. Therefore, cells are not at equilibrium. Moreover, because processes that bring a system towards equilibrium release energy, it follows that processes that bring the system away from equilibrium require energy. Therefore, cells must continuously gather energy from their surroundings to consistently maintain non-equilibrium conditions required to do work in the cell. You should keep this general principle in mind as we go through more specific examples in transport and metabolism.
Section 10.2 Free Energy
As we discuss energy, it is useful to have a way to quantify the energy released by a process. One way to calculate this is with the Gibbs Free Energy change equation,
[latex]ΔG = ΔH-TΔS[/latex]
where G = Gibbs free energy, H = enthalpy (breaking and forming covalent bonds), T = temperature, and S = entropy, and Δ (the uppercase Greek letter delta) denotes the change in these values due to the process occurring.
We can also graph the free energy change over the course of a process, and this can help us visualize whether the process will require or release energy. Figure 10.2a shows that the free energy of a system starts at 30 kJ/mol, but by the end of the process only has 10 kJ/mol. To calculate the free energy change, take the ending free energy and subtract the starting free energy: ΔG= 10–30 = -20kJ/mol. Where did the energy go?
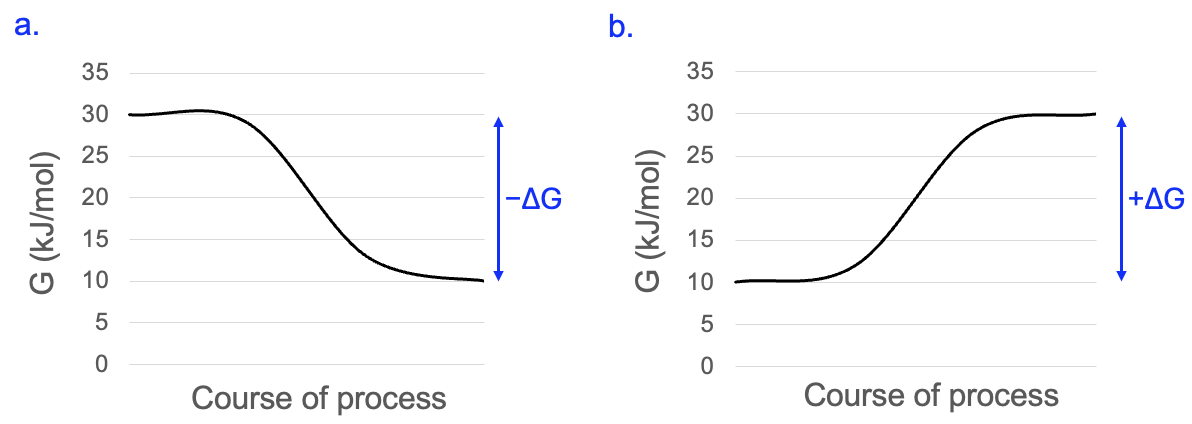
It was released to the surrounding environment and increases entropy. Another name for the process described in Figure 10.2a is exergonic, as energy exits the system. These types of processes are also referred to as spontaneous, not because they occur frequently, but because they do not require net energy input. We will use the term energetically favorable, as the negative ΔG means when this process occurs, it brings the system towards a lower energy state and closer to equilibrium.
Figure 10.2b shows the process in the opposite direction. Here, the system starts with 10 kJ/mol of free energy, and ends with 30 kJ/mol. This is a free energy change of 30–10 kJ/mol = +20 kJ/mol. Where did the increased free energy come from? It must come from another process that releases energy. Another way to describe the process in Figure 10.2b is endergonic, as energy must enter the system. This can also be called non-spontaneous, as it will not occur without energy input. We will use the term energetically unfavorable, as the ΔG means when this process occurs, it takes the system to a higher energy state and farther from equilibrium.
We will come back to concepts illustrated in these graphs many times. But it’s worth restating one idea, to be revisited further in later sections: without exception, only processes with negative ΔG values are energetically favorable and will occur.
Section 10.3 Free Energy Changes Associated with Molecule Movements
Let’s revisit the cell system from Figure 10.1 in the context of free energy, specifically the free energy change associated with moving the uncharged red circle molecule out of the cell. We can use this modified equation to calculate the ΔG:
[latex]\Delta{}G_{OUT} = RTln\frac{[outside]}{[inside]}[/latex]
Where R = the gas constant, T = temperature, ln = natural log, [inside] = the molecule concentration inside the cell, and [outside] = the molecule concentration outside of the cell. This equation is different from the prior equation as there are no chemical bonds changing, so we can leave out the ΔH term. Further, we can calculate the entropy by calculating the ratio of molecule concentrations outside versus inside the cell. Note that this is the equation to calculate the free energy change for moving the molecule out of the cell. To calculate the free energy change for bringing the molecule into the cell, the equation should be modified to divide [inside] by [outside].
We previously determined that cell in Figure 10.1a is at equilibrium, since the molecules concentrations are equal. Using our equation, this means that [outside]/[inside] = 1. You can use your calculator or prior knowledge to determine that the natural log of 1 is always zero. With ΔG=0, this system is at its lowest energy state and there is no free energy available to do work.
Another way to assess this is to think about concentration gradients. A gradient results from a difference in conditions from one area to another. A concentration gradient forms when there is an area of higher concentration and an area of lower concentration. While molecule movements are random, the overall trend observed is molecule movement from areas of higher concentration to areas of lower concentration. Thus, the gradient acts much like the current of a river, and net molecule movement is described as with (or moving down) the concentration gradient. If molecules are observed to move in a net direction that is from low to high molecule concentrations, this is against (or moving up) the concentration gradient. As you may know if you’ve ever tried to swim upstream, against a current, energy is required for this process. In the case of the cell in Figure 10.1a, there is no difference between the compartment inside the cell versus out, and hence no concentration gradient and no net movement.
For the cell in Figure 10.1b, because there are more molecules inside versus outside of the cell [outside]/[inside] gives a number less than 1. The natural log of a number less than 1 is negative, resulting in a negative ΔGOUT. If you wish, you can use [outside]=1 and [inside]=5, and RT=2.48 to approximate the ΔG. The sign of the ΔGOUT indicates what needs to happen for the system to reach equilibrium—molecules must move in the energetically favorable direction. In this case, as we predicted earlier, molecules moving out of the cell, from an area of high concentration to an area of low concentration, down the concentration gradient, would bring the system to equilibrium. Moreover, the movement of molecules out of this cell would not require any additional energy input, as the free energy change is already negative.
For the cell in Figure 10.1c, the opposite conditions are present: there are more molecules outside versus inside the cell. The ratio [outside]/[inside] is greater than 1, resulting in a positive ΔG for moving molecules out of the cell. This corresponds with the figure, which shows that equilibrium would be reached if molecules went into the cell. Thus, the movement of molecules out of the cell would move the system farther from equilibrium, consistent with the energetically unfavorable ΔGOUT. Movements from areas of low concentration to areas of higher concentration (up a concentration gradient) are energetically unfavorable. Therefore, net movement out of this cell would require energy input.
The above examples illustrate the meaning of the sign (positive or negative) of ΔG, as it tells you what needs to happen for the system to return to equilibrium. However, the value, or magnitude, of ΔG is also important, as it indicates how far the system is from equilibrium. Figure 10.3 shows two cells with the same outside concentration of the red molecule. However, the cell in Figure 10.3a has fewer molecules inside as compared to Figure 10.3b.
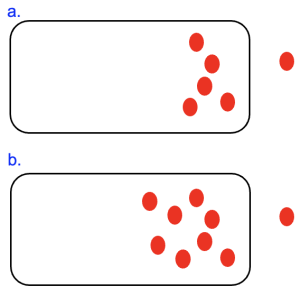
The ΔGOUT is negative in both cases, but we can see that the cell in Figure 10.3b is farther from equilibrium. As a result, more free energy would be released as the molecules in the bottom cell move out of the cell and reach equilibrium. Consistent with this, if we use our equation to calculate the ΔGOUT, we will find that the number is more negative in the case of the bottom cell.
Section 10.4 Free Energy Changes Associated with Chemical Reactions
Let’s return to chemical reactions and think about ΔG in this context. As reminder, the ΔG for a chemical reaction is experimentally determined, and is different for different reactions. However, there is a general rule for predicting the sign of ΔG that utilizes the Gibbs free energy equation at the start of section 10.2. The equation states that the change in entropy is subtracted from the change in enthalpy. Therefore, a reaction that greatly increases entropy is more likely to result in a negative ΔG, and therefore be energetically favorable. Conversely, a reaction that greatly decreases entropy is more likely to have a positive ΔG and be energetically unfavorable.
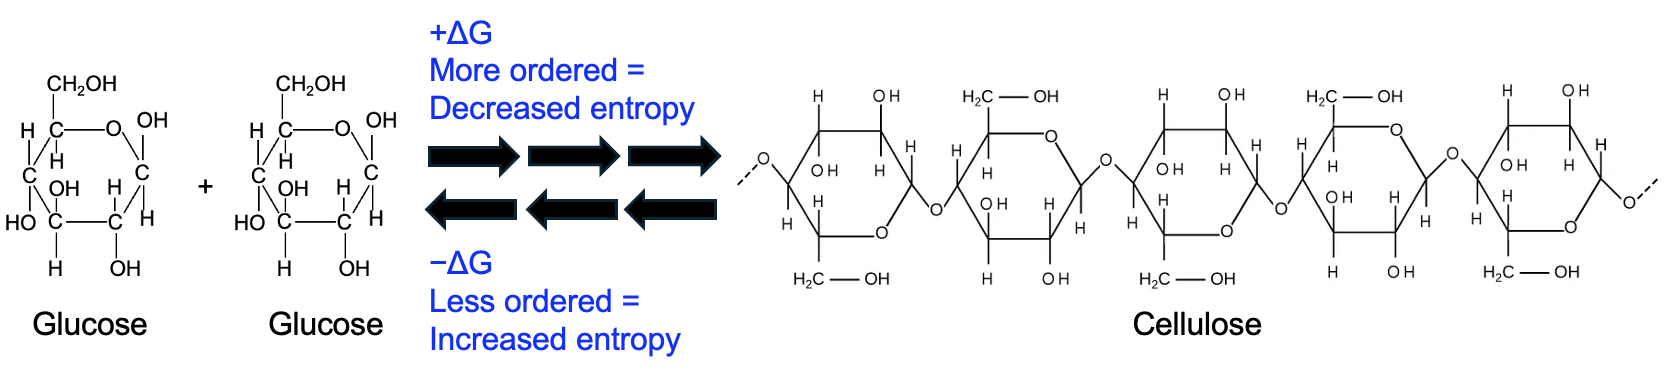
Let’s take the example of cellulose synthesis. Cellulose is formed when glucose monomers are linked with glycosidic bonds. Individual glucose molecules are much more disordered than when they are joined together into cellulose. Thus, the cellulose synthesis reaction decreases entropy, so the change in entropy is negative. When calculating ΔG, entropy is subtracted, and subtracting a smaller number makes the ΔG more positive. Thus, cellulose synthesis, and generally all synthesis reactions, are energetically unfavorable. Conversely, the reverse reaction of the breakdown of cellulose into glucose is energetically favorable because it increases the entropy.
It’s often the case that the free energy change of a reaction is not predictable from the chemical equation. However, if you are given the experimentally determined value of ΔG, you can use this to predict what will happen, as well as how changing specific conditions would affect the ΔG.
Let’s return to our generic reaction:
A + B [latex]\rightleftarrows[/latex] C + D
If we are told this reaction has a ΔG of 0 under certain conditions, what does it tell us? Well, this indicates that the system is at equilibrium, meaning the forward reaction occurs at the same rate as the reverse reaction, and there is no net production of reactants or products. Does this mean that A, B, C, and D have the same concentrations? No! Equilibrium does not mean equal concentrations, but rather that the ratios of products to reactants are at equilibrium concentrations.
What if conditions are different and we are told that the reaction has a negative ΔG? Because the ΔG is no longer zero, this means the reaction system is not at equilibrium. Further, the sign of ΔG indicates what will need to happen for the system to reach equilibrium. In this case, a negative ΔG indicates the forward reaction (left to right as written, producing C and D) is energetically favorable, and energetically favorable processes can occur without net energy input. So, we would predict that net production of C and D would occur.
Conversely, if we are told that the reaction has a positive ΔG, that again means the reaction system is not at equilibrium. Moreover, the forward reaction is energetically unfavorable and will not occur without energy input. However, this reaction is reversible, and if the forward reaction is unfavorable, that means the reverse reaction is energetically favorable and will occur. Thus, we would predict that net A + B would be produced.
Section 10.5 Energetic coupling
By now, you may have realized that cells seem to have a serious energetics problem. Cells carry out many reactions that require energy—gene expression alone requires the synthesis of RNA and protein—and synthesis reactions are energetically unfavorable as they decrease the entropy of the system. Further, only reactions that are energetically favorable can occur without net energy input.
Fortunately for cells (and us), there is a solution. For cells to carry out reactions that are energetically unfavorable, they need to link, or couple, those reactions to processes that will provide the needed energy. Through energetic coupling of a process that requires energy with a process that releases energy, such that the combined process is made energetically favorable, with a negative ΔG. For example, if a process requires 10 kJ/mol of energy, it could be energetically coupled to a process that has a ΔG of -15 kJ/mol, and the ΔG of the combined processes would be -5 kJ/mol.
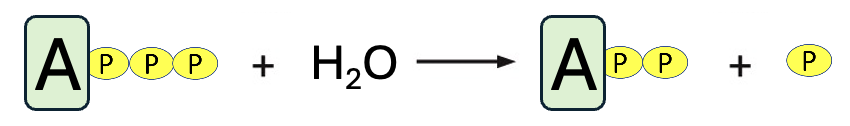
The process that often couples with unfavorable reactions involves a molecule referred to as the energy currency of the cell, ATP. Figure 10.5 shows the structure of ATP, or adensine triphosphate. Before explaining how cells use ATP, first see if you can recognize the structure of ATP. Hint, it’s a monomer that we’ve discussed previously!
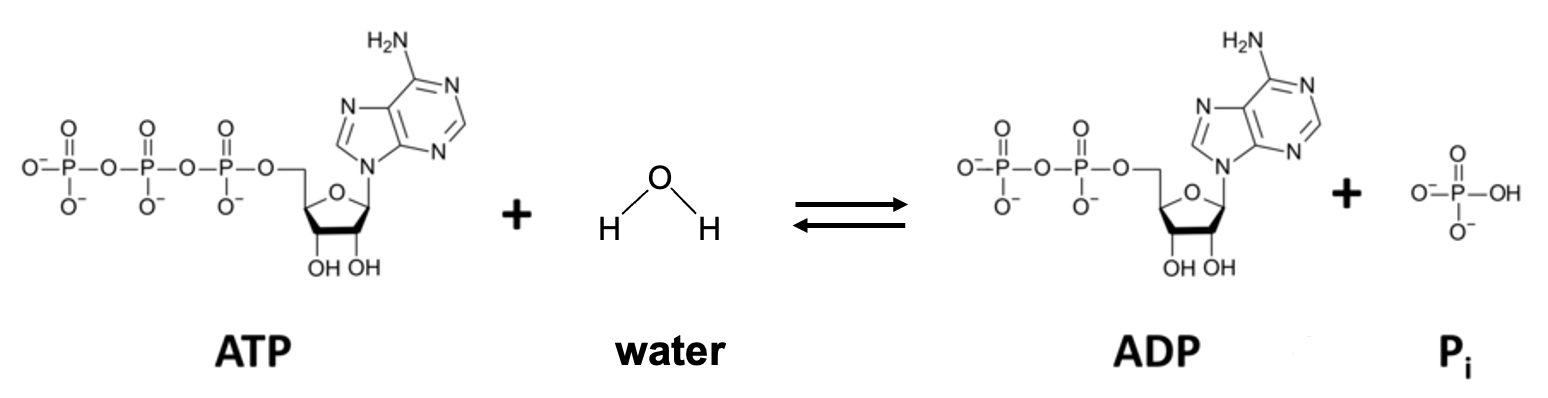
Your first step in identifying molecules is to first identify the smaller components. We can see the three phosphate groups on the left side of this molecule (indicated by “triphosphate” in the name). The chain of phosphates is connected to a sugar with 5 carbons, or a ribose sugar, and the sugar is in turn connected to a double-ring structure with several nitrogens. Based on these components, this is a nucleotide, and furthermore, it’s an RNA nucleotide, as the 2’ carbon has a hydroxy group attached. Thus, in addition to its role in cellular energetics, this molecule is also a building block for RNA, so it has an important role in gene expression. By the way, it’s not unusual to see molecules in cells with multiple roles!
In the reaction shown in Figure 10.5, ATP is dephosphorylated (a phosphate is removed) to form ADP (adenosine diphosphate) and inorganic phosphate, Pi. These products have much lower free energy than ATP, so the free energy change resembles the graph in Figure 10.2a. Under cellular conditions, this reaction has a ΔG of -57 kJ/mol. If the reaction occurs as shown in Figure 10.5, all the energy is released as heat, which increases entropy but isn’t very useful for the cell. However, the amount of energy released from the dephosphorylation of ATP, if coupled to an energy-requiring reaction, is sufficient to make the coupled process energetically favorable.
The disaccharide sucrose can be formed by combining glucose and fructose. This synthesis reaction has a ΔG of +23 kJ/mol. Using what we learned in the previous section, since the ΔG is positive, the formation of the reactants, glucose and fructose is favored, rather than the formation of products. Net sucrose, under these conditions, would not be produced.
However, if this reaction were coupled to the ATP reaction, it would occur in the forward direction and produce sucrose. This is because ATP dephosphorylation releases more energy than sucrose formation requires. However, to be coupled, the two reactions must occur together and are, in fact, blended in some way. As a result, coupling always requires a protein to link the two processes together, and in this case, an enzyme facilitates that reaction, although we won’t focus on the enzyme here.
Table 10.1 shows the original ATP reaction and the sucrose synthesis reaction in the top two rows, along with the ΔG of each reaction as written (uncoupled). The next two rows show the two steps of the coupled reaction.
| Reaction type | Reaction | Reaction energetics |
| Uncoupled ATP reaction | ATP + H2O [latex]\rightleftarrows[/latex] ADP + Pi
|
ΔG = -57 kJ/mol |
| Uncoupled sucrose reaction | glucose + fructose [latex]\rightleftarrows[/latex] sucrose
|
ΔG = +23 kJ/mol |
| Coupled ATP and sucrose reaction | Step 1: glucose + ATP [latex]\rightleftarrows[/latex] glucose-P + ADP
Step 2: glucose-P + fructose [latex]\rightleftarrows[/latex] sucrose + Pi
|
ΔG = -34 kJ/mol
(-57 kJ/mol + 23 kJ/mol ) |


In the first step, we see that glucose and ATP are the reactants, and a phosphate is transferred from ATP to glucose. This produces two products, the phosphorylated glucose and ADP, adenosine diphosphate. By adding the phosphate to glucose, its chemical properties are altered (remember that the phosphate group adds two negative charges), and that raises the free energy of glucose, making glucose a little less stable and a little more reactive. In fact, in the second step, the phosphorylated glucose reacts with fructose producing sucrose and inorganic phosphate. Note, the reactants and products of the coupled reaction are identical to the net products of two uncoupled reactions, only the details of the steps have changed. Moreover, the coupled reaction can occur in cells because it has a negative ΔG (-57 kJ/mol + 23 kJ/mol = -34 kJ/mol).
Another way to explain how this works is to use principles of equilibrium. This reaction of ATP to ADP and phosphate highly favors product formation (heavily shifted to the right side of the equation), given its very negative ΔG. In contrast, the sucrose reaction modestly favors reactant formation (somewhat shifted to the left). When these reactions are combined, the coupled reaction is also shifted the right (as evidenced by the very negative ΔG of the coupled reaction). In essence, the ATP reaction is so favorable that when it is tied to the other reaction, it drives the formation of sucrose.
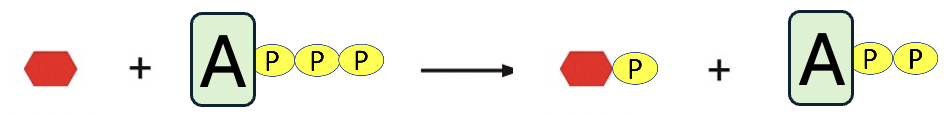
This strategy of using ATP to drive unfavorable chemical reactions is common in all forms of life and why ATP is called the energy currency of the cell. Figure 10.6 shows a generic example of the process.
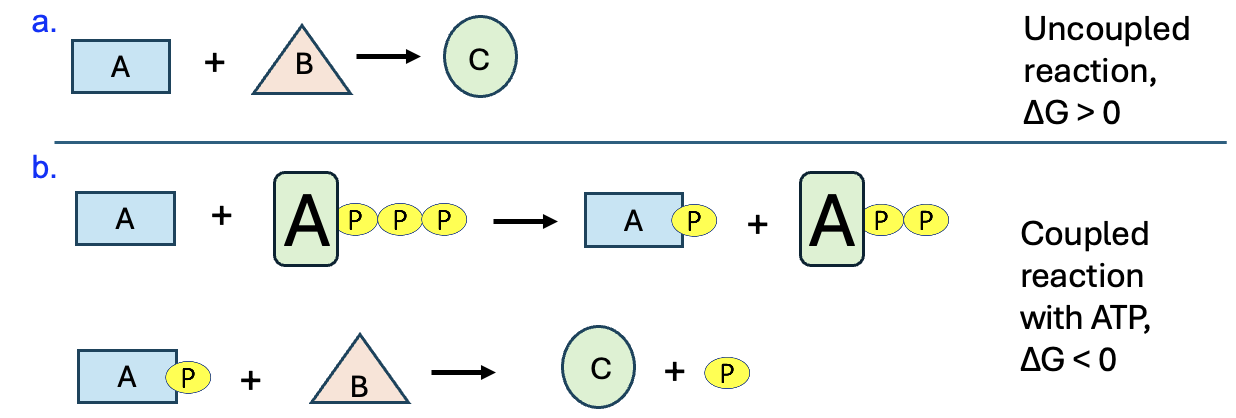
If the reaction of A and B to make product C has a positive ΔG, it’s energetically unfavorable and will not occur unless coupled to a reaction that can provide the necessary energy. When a reaction is coupled to ATP breakdown, the first step is for ATP to react with one of the reactants. In this example let’s say ATP reacts with molecule A. In the first step, a phosphate is transferred from ATP to A, producing phosphorylated A and ADP. This phosphorylated A molecule is called an “activated phosphorylated intermediate.” “Intermediate” refers to the fact that this molecule is not a final product, but will instead be used in the next step of the reaction. Also, the phosphorylated molecule has higher potential energy than the original reactant. This higher potential energy will allow phosphorylated A to react with molecule B and produce desired product. The inorganic phosphate displaced by B is another product. Since the coupled reaction has a negative ΔG, product formation is favored and occurs.
Where are we going with this? Well, ATP is the energy currency of the cell, used to drive many unfavorable processes in cells. Thus, cells need a generous supply of ATP to support all the energy-requiring processes that occur constantly. Also, if the dephosphorylation of ATP releases energy, then the reverse reaction, combining ADP and Pi to make ATP, requires energy (+57 kJ/mol for each ATP). Where do cells find the energy to make ATP? This is the broad purpose of cellular respiration, which is a complex metabolic pathway to break down glucose into CO2 and H2O in the presence of oxygen gas, O2. This reaction, also referred to as glucose oxidation, has a ΔG of -2800 kJ/mol. Thus, it’s a highly favorable process and can be coupled to reactions to synthesize ATP. As we learn the details of cellular respiration in a later chapter, keep in mind the processes and goal: it’s just a bunch of coupled processes to produce ATP.
Exercises
Section 10.6 Enzymes
In the previous section, we learned that the overall reaction for glucose oxidation, shown below, is highly energetically favorable.
C6H12O6 + 6 O2 [latex]\rightleftarrows[/latex] 6 CO2 + 2 H2O
Remember that this reaction in the left to right direction is referred to as spontaneous, which might imply that it is likely to happen and happens often. However, chemists have a different definition of spontaneous—scientifically, it means that the reaction is energetically favorable and releases net energy. Also, glucose as reactant is quite stable and not very reactive. Instead, for this and most other spontaneous reactions to occur, there needs to be an input of energy, also called activation energy. In a chemical reaction, this energy input is necessary so the reactants encounter each other with sufficient kinetic energy to react.
Figure 10.7a shows the energy for a population of molecules; use the height of the dashed black line to determine the number of molecules with a specific amount of energy. In this scenario, a small number of molecules have very low energy, and a small number have very high energy, but most are at intermediate levels. The solid red line marked with the arrow indicates the energy needed for a specific reaction to occur.
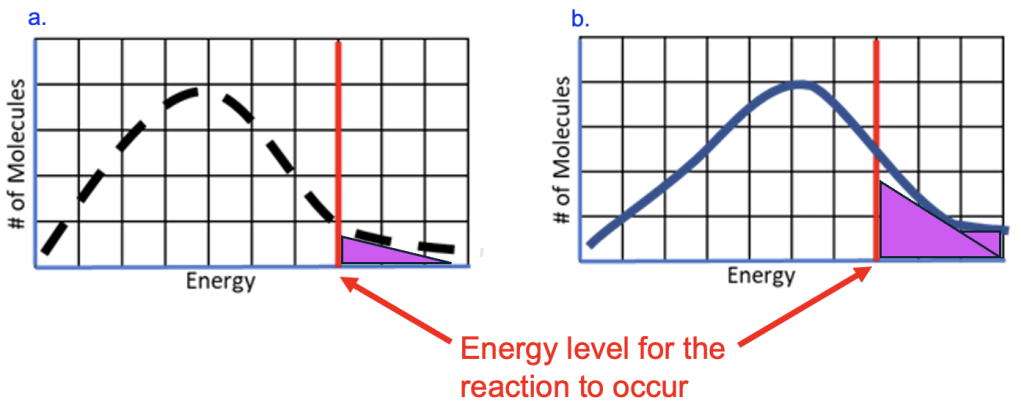
Only molecules with energy above the red line will be able to react, indicated by the purple shading. This is a small fraction of the total number of molecules, so the reaction will be occurring at a low rate.
To increase the rate of the reaction, we could add energy so that more molecules are above the energy threshold. If heat is applied to the mixture, this raises the energy level of all molecules, shifting the curve in the graph to the right (Figure 10.7b, the solid line represents the new energy distribution). As a result, a greater proportion of molecules (purple shading) have energy above the activation energy (solid red line) and can react to form the product.
Unfortunately, while increasing temperatures to increase reaction rates is feasible in chemistry labs, this is not a workable strategy in most biological systems. Remember that proteins need to fold into specific shapes to carry out their functions, and adding excess heat energy could potentially cause these proteins to denature. So, cells need a different way to increase the reaction rates using conditions typically found in cells (physiological conditions).
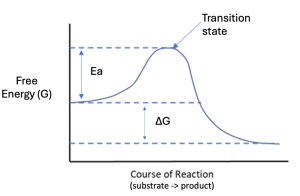
Figure 10.8 shows a different representation relating energy and chemical reactions, called a reaction coordinate diagram. In this graph, energy is now on the Y axis, and line represents the free energy change over the course of the reaction, as reactants are transformed into products. Notably, there is some free energy at the start of the reaction. Next, we see the free energy increases to a peak before decreasing to an energy level that is lower than the initial starting amount. This final energy level is the free energy of the products. Comparing the free energy at the end of the reaction to the energy at the start, does this represent an energetically favorable or unfavorable reaction? Since the products have lower free energy than the reactants, this is an energetically favorable reaction, with a negative ΔG. Like the graph in Figure 10.2a, you could also describe the reaction in Figure 10.8 as exergonic and spontaneous.
The new feature in Figure 10.8 versus Figure 10.2a is the initial energy input. This reaction requires an input of energy for the reaction to proceed. The peak energy is referred to as the transition state (Ts), and molecules must reach this transition state to proceed to form products. The difference between the transition state energy and the starting energy is that activation energy (Ea). The activation energy is always a positive value, since energy needs to be added for the reaction to occur. Likewise, the transition state energy is always higher than the potential energy of our reactants. Even if a reaction has a positive ΔG (sketch this out on your own), the Ea is always positive and the TS is always higher than the starting free energy.
Before proceeding with the reading, watch this video on enzymes, focusing on the first 2 minutes of the video.
The remainder of the video contains very specific details that are beyond the scope of this course. If you take an upper-level biochemistry course, you will explore these ideas in more detail then.
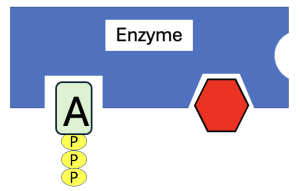
To recap some big ideas from the video, enzymes are proteins that speed up chemical reactions by lowering the activation energy of those reactions. There are several different ways in which enzymes lower activation energy, but one way that easy to visualize is that enzymes bring substrates together. As we discussed in Chapter 7, enzymes have active sites with a particular shape and chemical properties to bind to specific substrates and orient them in a way that makes them more likely to react. Figure 10.9 shows a hypothetical enzyme (blue shape) with active sites that bind to ATP and glucose to phosphorylate it.
Although not shown, the interactions among enzymes and substrates may involve transient covalent bonds, but mostly they interact through weak, noncovalent forces (for example, hydrogen bonding, ionic bonding, and hydrophobic clustering. This specificity means that a given enzyme only binds to a few kinds of molecules and carries out specific reactions on those molecules. And as we modeled earlier, if the active site properties are altered, the enzyme may not be able to carry out that specific reaction. Lastly, as with all catalysts, enzymes are not altered or used up in the reaction.
Regulation of enzymes
One of the advantages of using enzymes to carry out chemical reactions is that their activity can be regulated. They can be sped up or slowed down depending upon the presence of other molecules that bind to the enzyme and change its shape and/or function. For example, if another molecule has a shape that resembles the substrate, it can bind to the active site and block the substrate from binding (Figure 10.10a). This is known as a competitive inhibitor, since it competes with the substrate for binding to the enzyme and thus inhibits the function of the enzyme.
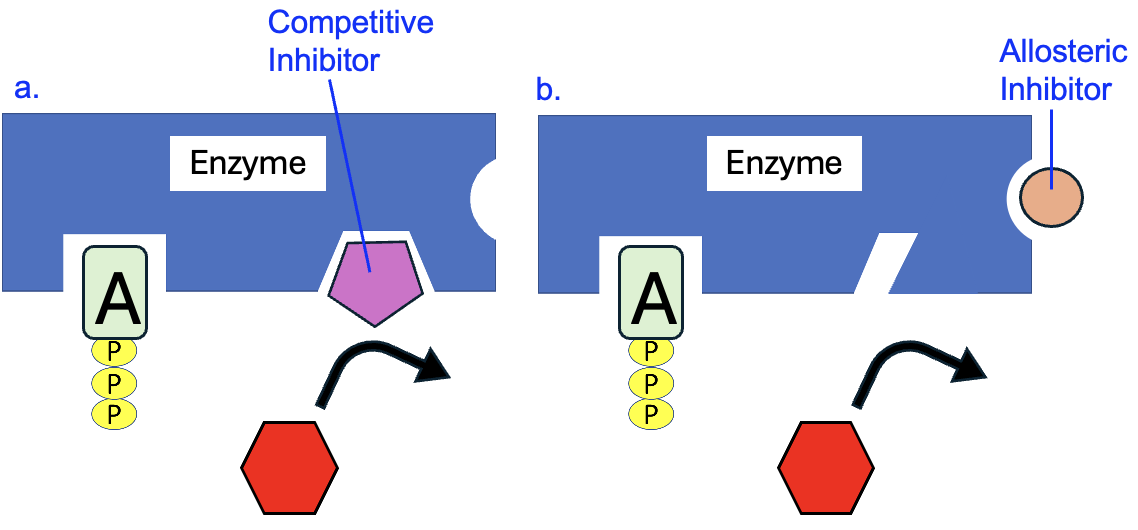
A more common form of regulation involves allosteric molecules. These are molecules that bind to enzymes in locations other than the active site, causing the enzyme to change shape in a way that either increases or decreases the function of the enzyme (“allo” means different, and “steric” means shape). In Figure 10.10b, a noncompetitive inhibitor (square shape) binds to the allosteric site on the enzyme, changing the shape of the active site so the substrate can no longer bind. Alternatively, allosteric inhibitors can change the shape in such a way that the enzyme still binds to substrates, but cannot facilitate the chemical reaction. Allosteric molecules can also act as activators if they cause a change in enzyme shape that increases the function of the enzyme.
As we discuss the reactions of metabolism, we will not be covering all the enzymes involved. However, enzymes are necessary to most steps these pathways, allowing these reactions happen at reasonable rates under physiological conditions. Rest assured, though, a future biochemistry course will provide all the lovely details about these enzymes!
